 Thread:


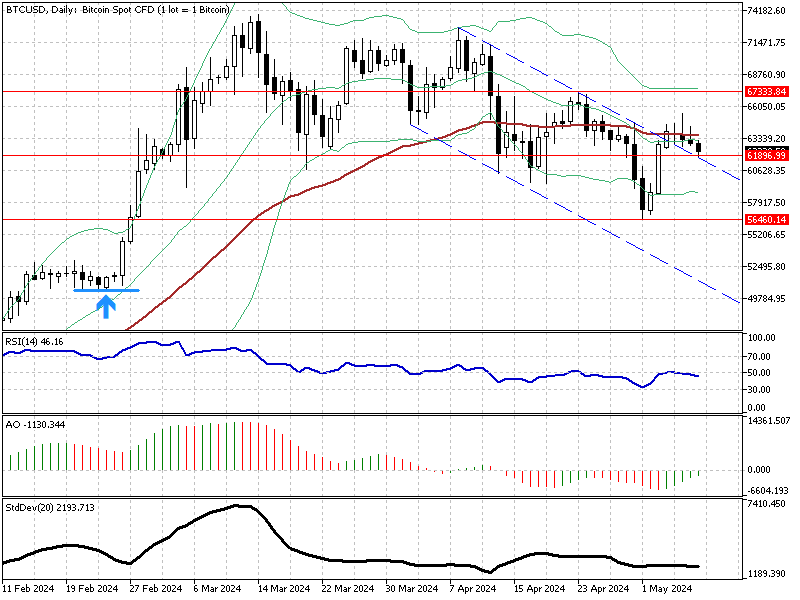
BTC Bulls Eye Higher Targets Despite Price Dip
Solid ECN – Bitcoin broke out of the descending trendline (in blue), but the bulls failed to stabilize the price above the EMA 50 and the middle line of the Bollinger Band. Consequently, the pair formed a long-wick bearish candle on the daily chart. As of this writing, the BTC/USD pair has dipped and is currently testing the broken resistance at $61,896.
The technical indicators provide mixed signals. RSI hovers below 50, but AO is bullish, showing a green line.
From a technical perspective, the bullish outlook remains valid if the BTC/USD price remains above $61,896. In this case, the next target could be $67,333.
On the flip side, the downtrend will resume if the price falls below the support level, with $56,460 as the next support level.
Malaysia Forex Forum
- Forum
- Forex Charts
- Monitoring
- Forex TV

-
Senior Member


- Join Date
- Oct 2022
- Posts
- 1,183
- Thanks
- 1
- Thanked 1,564 Times in 522 Posts
Though trading on financial markets involves high risk, it can still generate extra income in case you apply the right approach. By choosing a reliable broker such as InstaForex you get access to the international financial markets and open your way towards financial independence. You can sign up here.
-
Senior Member
- Join Date
- Oct 2022
- Posts
- 1,183
- Thanks
- 1
- Thanked 1,564 Times in 522 Posts
Economic Indicators Show Growth and Stability in Mexico

Solid ECN – The Mexican peso has rallied to approximately 16.8 per USD, marking a significant rebound from its five-month trough of 17.2 on April 25th. This upturn is primarily attributed to a widespread weakening of the U.S. dollar, spurred by indications that the Federal Reserve might implement two rate cuts within the year.
These speculations were fueled by a moderated growth in U.S. job numbers for April and a surprising increase in the unemployment rate, compounded by Federal Reserve Chair Powell's earlier dismissal of any forthcoming rate hikes.
Stable Monetary Outlook as Mexican Economy Grows
On the domestic front, Mexico's central bank, Banxico, is expected to maintain its interest rates at 11% in its upcoming May 9th meeting, consistent with its rate cut in March. However, emerging data might spark discussions among Banxico's Governing Council members about potential policy adjustments.
Additionally, Mexico's economic growth has accelerated, with a 0.2% expansion in Q1 of 2024 compared to 0.1% in the previous quarter, surpassing market expectations. Business confidence remains robust, near an 11-year peak, even as inflation persists above 4%.Though trading on financial markets involves high risk, it can still generate extra income in case you apply the right approach. By choosing a reliable broker such as InstaForex you get access to the international financial markets and open your way towards financial independence. You can sign up here.
-
Senior Member
- Join Date
- Oct 2022
- Posts
- 1,183
- Thanks
- 1
- Thanked 1,564 Times in 522 Posts
Canadian Dollar Climbs as US Jobs Disappoint
Solid ECN – The Canadian dollar peaked at 1.36 per USD, marking its strongest position since April 9th. This surge comes as the U.S. dollar experiences widespread weakness triggered by disappointing labor market data.
The U.S. economy added 175,000 jobs in April, falling short of the anticipated 243,000. This underperformance, coupled with a higher jobless rate and slowed wage growth, fuels speculation that the Federal Reserve might implement its first rate cut in September.
Economic Slowdown Signals Potential Rate Cuts in Canada
In parallel, Canada's economic indicators suggest a similar downturn, hinting at a possible earlier rate adjustment by the Bank of Canada. The Manufacturing PMI in Canada dropped to 49.4 in April 2024, signaling continuous contraction in factory activity for a twelfth consecutive month and falling below the expected 50.2.
Furthermore, with the economy only growing by 0.2% in February and predictions of stagnation in March, pressures mount for monetary policy adjustments.Though trading on financial markets involves high risk, it can still generate extra income in case you apply the right approach. By choosing a reliable broker such as InstaForex you get access to the international financial markets and open your way towards financial independence. You can sign up here.
-
Senior Member
- Join Date
- Oct 2022
- Posts
- 1,183
- Thanks
- 1
- Thanked 1,564 Times in 522 Posts
Silver Prices Bounce Back
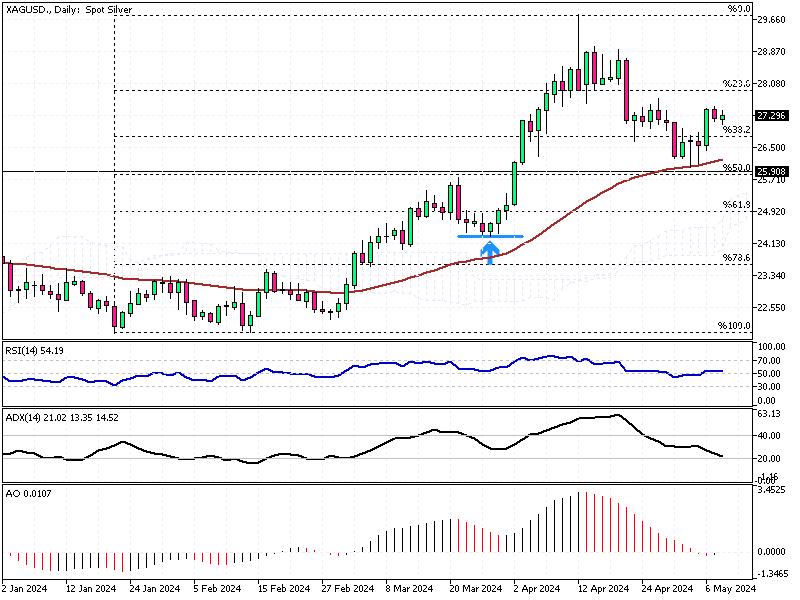
Solid ECN – Silver prices have risen above $27 per ounce after a dip to one-month lows near $26.3 last week. This rebound aligns with other precious metals and reflects investor anticipation of a possible interest rate cut by the Federal Reserve in September.
The recent U.S. jobs report, which did not meet analysts' expectations, has further convinced traders that the Fed might reduce interest rates later this year. Such economic signals are critical for investors looking to understand potential market movements.
Additionally, silver's demand increased as investors sought safe-haven assets following a military operation in Rafah by Israel, prompting evacuation warnings to Palestinian civilians. This situation has added to the precious metal's appeal during geopolitical uncertainty.Though trading on financial markets involves high risk, it can still generate extra income in case you apply the right approach. By choosing a reliable broker such as InstaForex you get access to the international financial markets and open your way towards financial independence. You can sign up here.
-
Senior Member
- Join Date
- Oct 2022
- Posts
- 1,183
- Thanks
- 1
- Thanked 1,564 Times in 522 Posts
Oil Prices Stabilize Amid Geopolitical Tensions
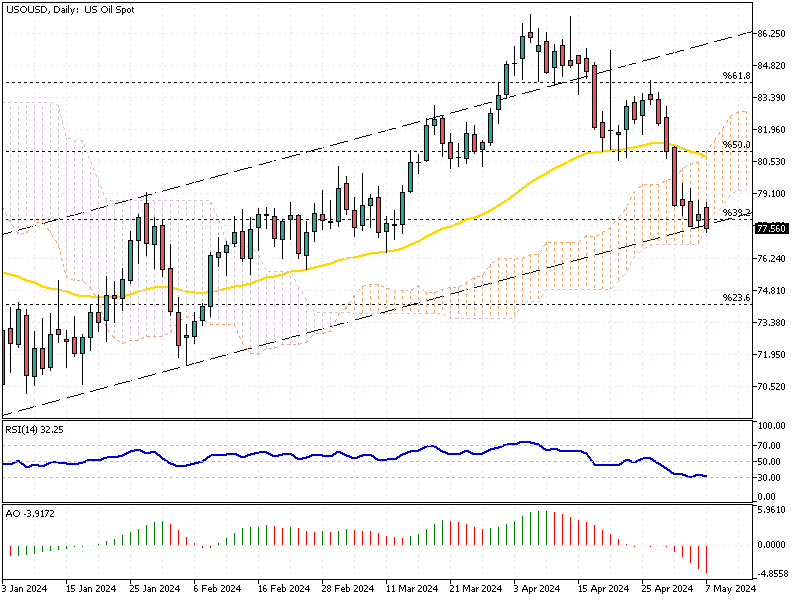
Solid ECN – WTI crude futures remained steady, trading at approximately $77 per barrel as of Tuesday. This stability comes despite the market being close to its nearly two-month low of $78.1, recorded on May 3rd. The current price balances ongoing geopolitical concerns and the global perception of an ample oil supply.
Impact of Middle East Tensions on Oil Prices
Despite escalating tensions in the Middle East, where the Israeli military cabinet has unanimously rejected a ceasefire agreement with Hamas, the situation has not severely disrupted oil shipments.
Notably, the absence of significant military escalations involving Iran has ensured that oil tanker movements through the critical Strait of Hormuz continue unimpeded. This situation has helped alleviate fears of potential new U.S. sanctions or disruptions in oil supply.
OPEC's Strategy and Global Oil Supply
In response to the current market conditions, Saudi Arabia has increased the official selling price of its Arab Light crude by 90 cents per barrel for June, exceeding market expectations by 30 cents.
This adjustment suggests that OPEC’s largest producer is likely to advocate for extending production cuts into the next quarter, aiming to stabilize prices and address the relatively loose supply on the global stage.Though trading on financial markets involves high risk, it can still generate extra income in case you apply the right approach. By choosing a reliable broker such as InstaForex you get access to the international financial markets and open your way towards financial independence. You can sign up here.
-
Senior Member
- Join Date
- Oct 2022
- Posts
- 1,183
- Thanks
- 1
- Thanked 1,564 Times in 522 Posts
USDMXN - Banxico Rate Decision Looms
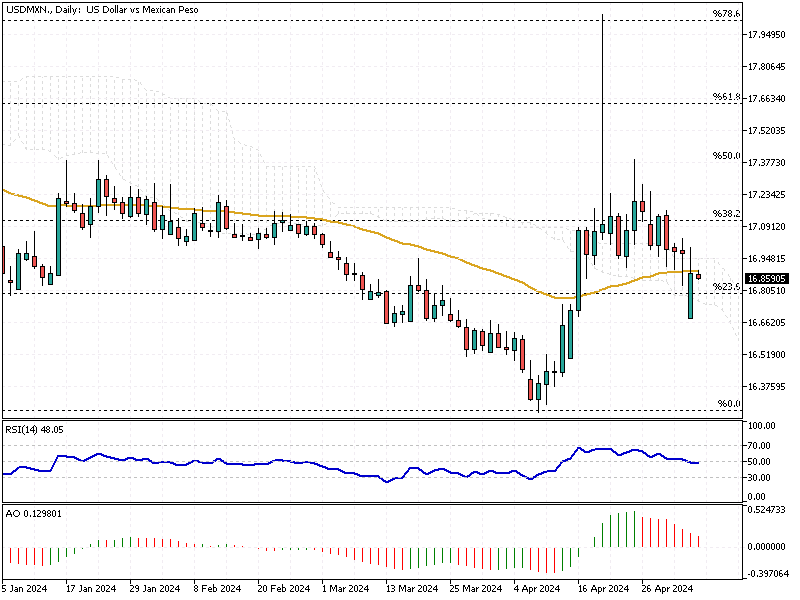
Solid ECN—The Mexican peso has shown remarkable resilience. It is trading at approximately 16.8 per USD, a significant recovery from its five-month low of 17.2 recorded on April 25th. This improvement is largely due to a weakened U.S. dollar, spurred by increasing indications that the Federal Reserve might implement two rate cuts later this year.
Contributing factors include moderated job growth and a rise in the U.S. unemployment rate in April, alongside Federal Reserve Chair Powell’s recent dismissal of potential rate hikes.
Economic Indicators and Policy Outlook
Amidst these currency shifts, Mexico’s central bank, Banxico, is expected to maintain its interest rate at 11% on May 9th, holding steady after a reduction in March. However, emerging economic data could spark discussions among Banxico’s Governing Council members about possible policy changes.
The Mexican economy showed signs of acceleration, expanding by 0.2% in the first quarter of 2024, outpacing the previous quarter’s growth and surpassing market expectations. Additionally, business confidence in Mexico is robust, remaining near an 11-year high, although inflation exceeds 4%.Though trading on financial markets involves high risk, it can still generate extra income in case you apply the right approach. By choosing a reliable broker such as InstaForex you get access to the international financial markets and open your way towards financial independence. You can sign up here.
-
Senior Member
- Join Date
- Oct 2022
- Posts
- 1,183
- Thanks
- 1
- Thanked 1,564 Times in 522 Posts
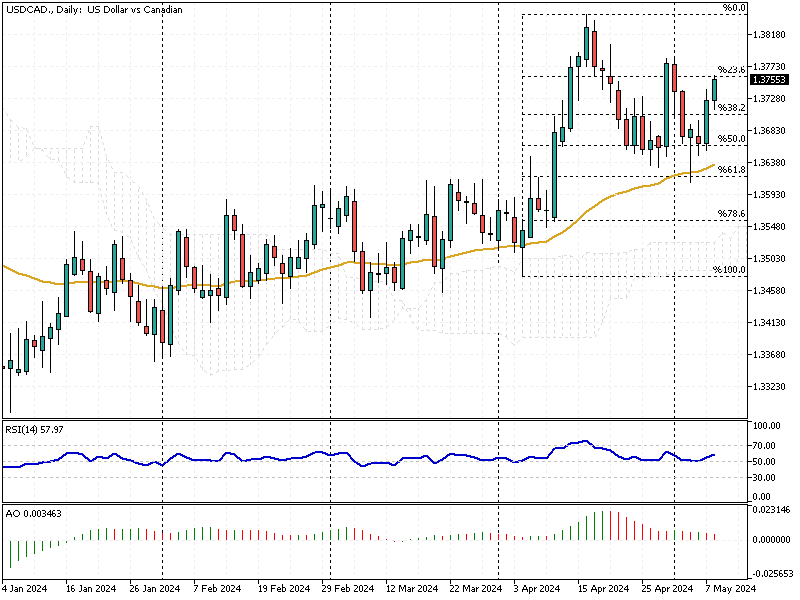
USDCAD - Canadian Dollar Surge
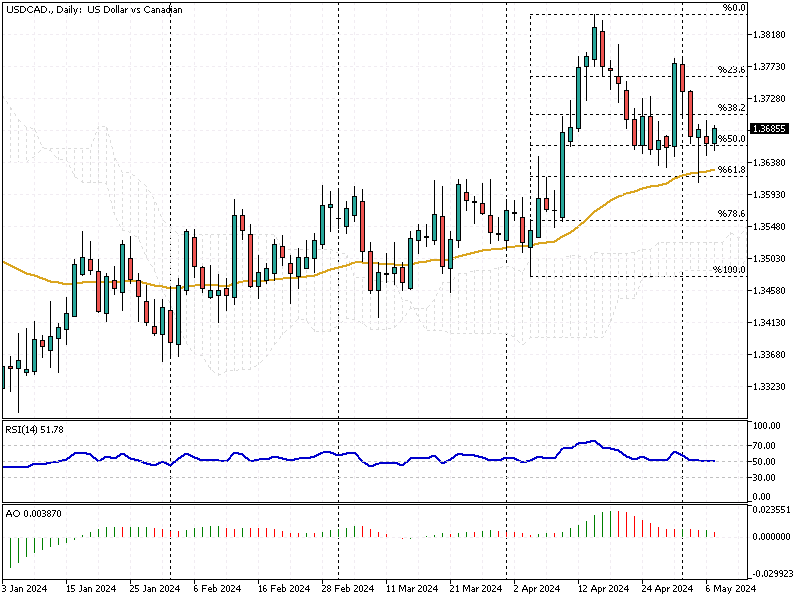
Solid ECN – The Canadian dollar recently hit a high of 1.36 USD, marking its strongest position since early April. This rise comes amid a widespread weakening of the U.S. dollar, driven by disappointing labor statistics from the U.S. The data showed only 175,000 new jobs created in April, well below the anticipated 243,000.
This underperformance, coupled with slower wage growth and a slight increase in unemployment, suggests that the Federal Reserve may cut rates as early as September.
Economic Indicators in Canada
In contrast, economic signals from Canada also hint at an upcoming rate adjustment, with several key indicators underscoring potential economic challenges. The Manufacturing PMI fell to 49.4, indicating continued contraction in factory activity for the twelfth consecutive month.
Furthermore, the Canadian economy's growth was a modest 0.2% in February, with expectations of stagnation in March, signaling a possible earlier rate cut by the Bank of Canada.Though trading on financial markets involves high risk, it can still generate extra income in case you apply the right approach. By choosing a reliable broker such as InstaForex you get access to the international financial markets and open your way towards financial independence. You can sign up here.
-
Senior Member
- Join Date
- Oct 2022
- Posts
- 1,183
- Thanks
- 1
- Thanked 1,564 Times in 522 Posts
NZ Dollar Dips Amid US Stability
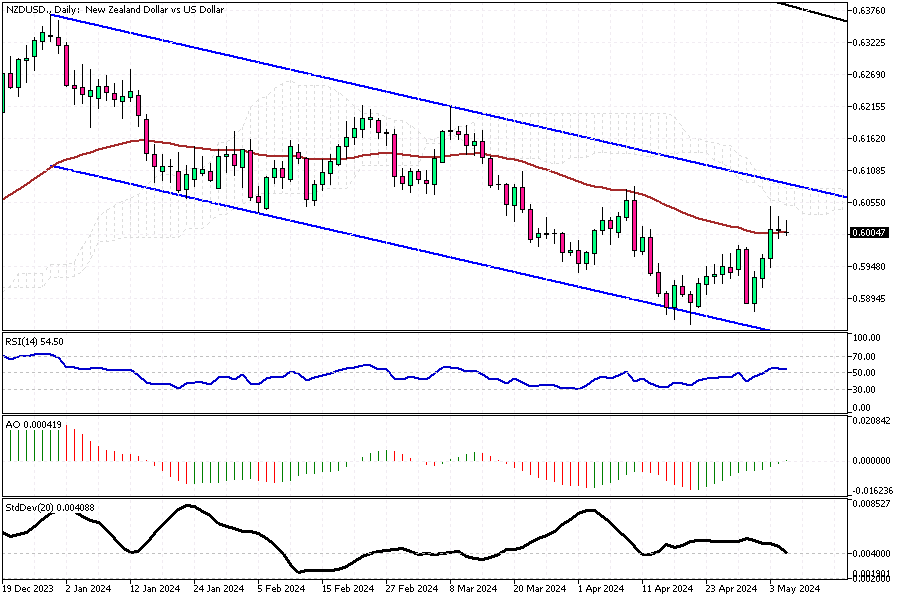
Solid ECN – The New Zealand dollar recently fell to $0.6 against a stabilizing US dollar. This shift came as fresh economic indicators suggested a potential cut in US interest rates later this year. Concurrently, the Kiwi mirrored the Australian dollar's downturn after the Reserve Bank of Australia opted to maintain its current interest rates, adopting a less aggressive stance than many anticipated.
Geopolitical Influences
Investors closely monitor the Middle East, where recent developments could impact global markets. Following Hamas's acceptance of a ceasefire in Gaza proposed by mediators, tensions remain as Israel did not agree to the terms, continuing military operations in Rafah and planning further negotiations.
New Zealand's Economic Outlook
In New Zealand, despite market expectations leaning towards an interest rate cut by October, fueled by recent weaker employment figures, the central bank has indicated it might hold off on easing monetary policy until 2025. This decision is based on persistently high inflation rates in the year's first quarter.Though trading on financial markets involves high risk, it can still generate extra income in case you apply the right approach. By choosing a reliable broker such as InstaForex you get access to the international financial markets and open your way towards financial independence. You can sign up here.
-
Senior Member
- Join Date
- Oct 2022
- Posts
- 1,183
- Thanks
- 1
- Thanked 1,564 Times in 522 Posts
Gold Prices Rise Amid Fed Speculations
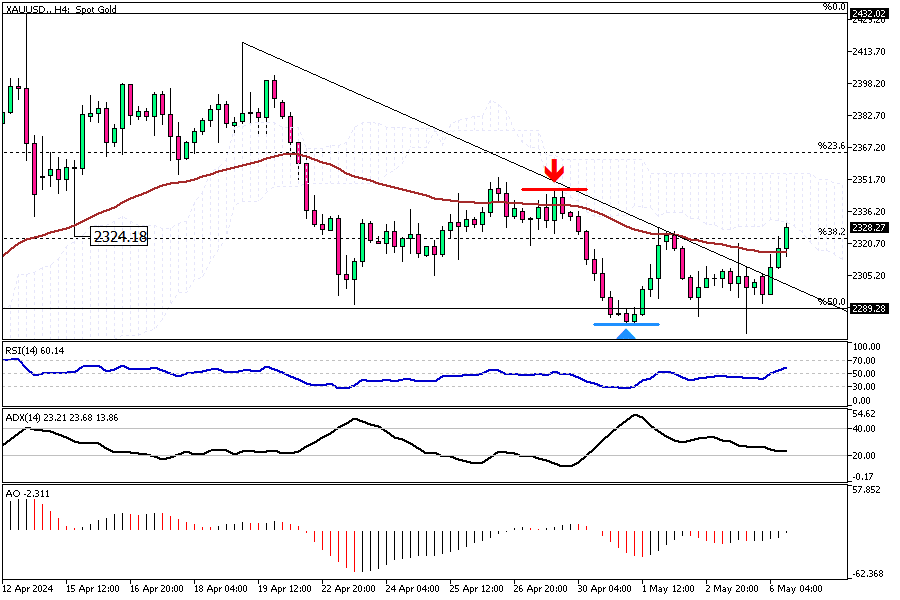
Solid ECN – Gold prices climbed to $2,310 per ounce on Monday, rebounding from a near one-month low. This surge is influenced by anticipation of upcoming remarks from Federal Reserve officials, which traders are eyeing for hints about potential interest rate cuts.
This keen interest stems from recent U.S. labor data that indicated a slowdown in job growth last April, suggesting that the Fed might start reducing rates later in the year.
Interest Rate Expectations and Gold's Appeal
The possibility of reduced interest rates, which decrease the opportunity cost of holding gold, has bolstered the metal's attractiveness. According to the CME's FedWatch Tool, there's a 67% likelihood of a rate cut by September.
Furthermore, geopolitical tensions, such as the fading hopes for a Gaza ceasefire reported on Sunday, have heightened gold's status as a safe-haven asset.
Global Gold Demand Fluctuates
Despite the price drop, gold demand in India remained subdued last week, with buyers waiting for further price declines. In China, gold premiums decreased for the second consecutive week, reflecting reduced demand during the holiday period.Though trading on financial markets involves high risk, it can still generate extra income in case you apply the right approach. By choosing a reliable broker such as InstaForex you get access to the international financial markets and open your way towards financial independence. You can sign up here.
-
Senior Member
- Join Date
- Oct 2022
- Posts
- 1,183
- Thanks
- 1
- Thanked 1,564 Times in 522 Posts
Oil Prices Rebound on Supply Cuts
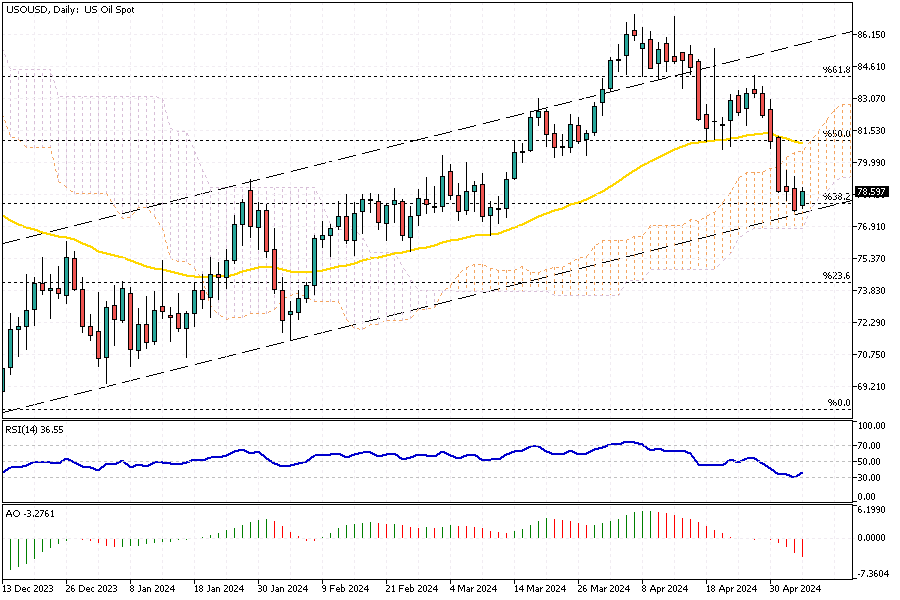
Solid ECN—WTI crude oil futures rose above $78.5 per barrel on Monday, rebounding from a near two-month low of $78.1. This uptick is attributed to new developments suggesting a decrease in supply. Notably, Saudi Aramco increased the official selling price of its Arab Light crude by 90 cents per barrel for June deliveries. This adjustment exceeds the market’s anticipation of a 60-cent hike, underscoring a robust outlook from OPEC+ on sustained supply cuts.
Geopolitical Tensions Affect Oil Markets
Further influencing oil prices, geopolitical tensions have escalated. Following a series of rocket attacks by Hamas over the weekend, Israel responded by closing the Kerem Shalom crossing into Gaza and advised civilians in Rafah to evacuate. This move jeopardizes the recent hopes for a ceasefire and stirs concerns about regional stability, impacting global oil markets.
Guidance for Traders and Investors
These developments suggest a cautious approach to oil-linked currencies and investments for forex traders and investors. Monitoring the evolving geopolitical landscape and OPEC+ decisions will be crucial to effectively navigating the volatile oil market.Though trading on financial markets involves high risk, it can still generate extra income in case you apply the right approach. By choosing a reliable broker such as InstaForex you get access to the international financial markets and open your way towards financial independence. You can sign up here.
Results 1 to 10 of 1199

 Reply With Quote