 Thread:


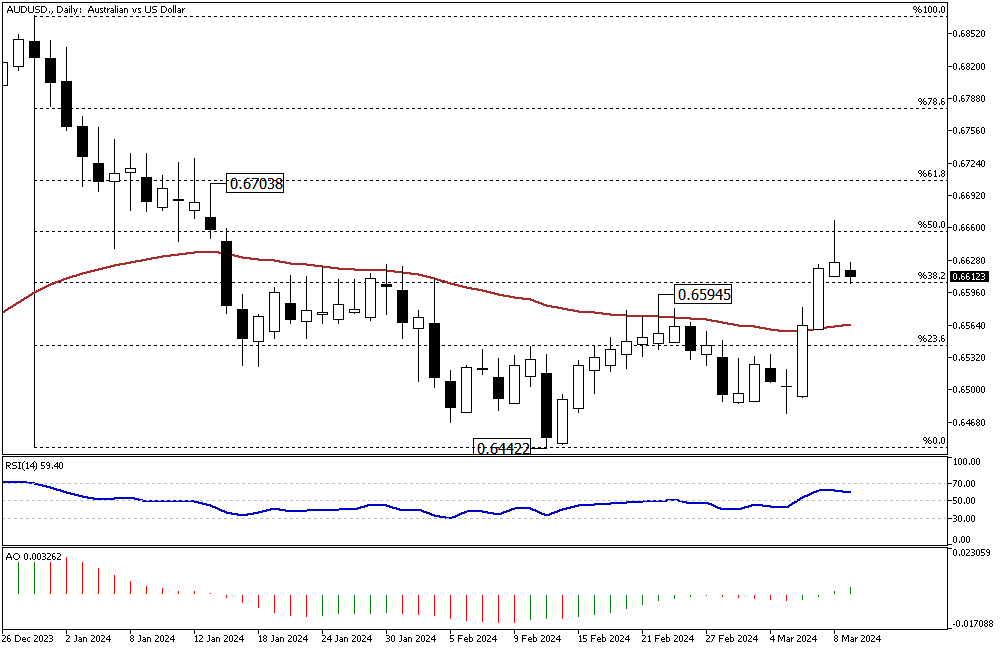
AUDUSD Analysis: Signs of Bullish Resurgence
Solid ECN Blog — The AUDUSD formed a long-wick candlestick pattern during Friday's trading session. As of this writing, the price tested the 38.2% Fibonacci support and is trading at about 0.661. Interestingly, the Awesome Oscillator has flipped above the signal line on the daily chart, which can be interpreted as a sign that the bull market may resume.
From a technical standpoint, the 0.6594 level supports the bull market. As long as the price remains above it, the next bullish target could be the 61.8% Fibonacci resistance at the 0.6703 mark.
Conversely, if the price dips below the 38.2% level, the decline could extend to the EMA 50, followed by the 23.6% level.
Malaysia Forex Forum
- Forum
- Forex Charts
- Monitoring
- Forex TV

-
Senior Member


- Join Date
- Oct 2022
- Posts
- 1,190
- Thanks
- 1
- Thanked 1,564 Times in 522 Posts
Though trading on financial markets involves high risk, it can still generate extra income in case you apply the right approach. By choosing a reliable broker such as InstaForex you get access to the international financial markets and open your way towards financial independence. You can sign up here.
-
Senior Member
- Join Date
- Oct 2022
- Posts
- 1,190
- Thanks
- 1
- Thanked 1,564 Times in 522 Posts
Experience Transparent and Efficient Forex Trading with Solid ECN
At Solid ECN, we redefine your trading experience by eliminating reliance on market makers. Our system directly pairs trading parties and forwards orders to liquidity providers, establishing ourselves as an actual ECN broker to optimize your trading strategies.
Our platform is engineered for speed, delivering faster trade executions alongside competitive spreads, further complemented by increased leverage and unparalleled transparency.
We value the security of your investments. To ensure this, we segregate client funds from our company assets and house them safely in leading international banks.
Solid ECN grants rapid access to the most liquid markets, enabling efficient and timely order execution. Our commitment is full transparency; we have no hidden fees or unfair practices. Enjoy 24/7 trading on various assets, including commodities, Forex, and cryptocurrencies, through the advanced MetaTrader 5 platform. Our flexible leverage options, ranging from 1:1 to 1:1000, facilitate meticulous risk management. Additionally, the platform supports scalping strategies with its quick order processing and tight spreads. We also offer hedging solutions to protect against inflation or to help reduce potential losses.
Join Solid ECN for an enhanced trading journey where market transparency and fair pricing stand at the forefront, ensuring a trading environment free from manipulation tailored for forex traders worldwide.
https://solidecn.com >>> %15 Bonus | Swap Free | Raw Spread | RegulatedThough trading on financial markets involves high risk, it can still generate extra income in case you apply the right approach. By choosing a reliable broker such as InstaForex you get access to the international financial markets and open your way towards financial independence. You can sign up here.
-
Senior Member
- Join Date
- Oct 2022
- Posts
- 1,190
- Thanks
- 1
- Thanked 1,564 Times in 522 Posts
Euro Hits New High Amid ECB Meeting Anticipation and Inflation Data Insights
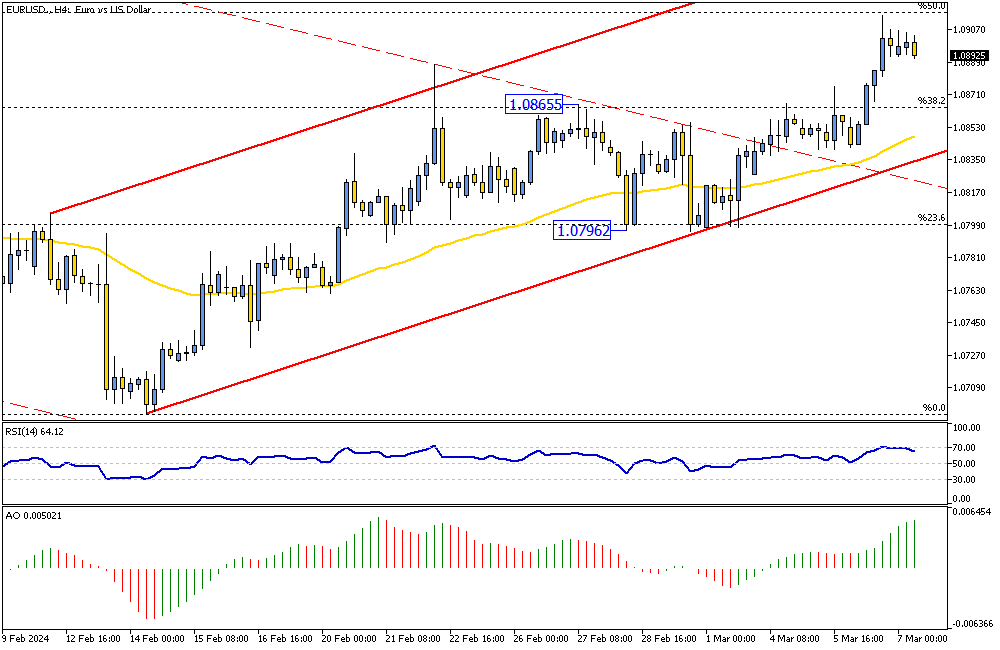
Solid ECN – The euro rose sharply to $1.085, reaching its highest point since February 1. This spike was due to investors focusing on the European Central Bank's (ECB) next meeting about monetary policy later this week. They are looking for new information on the ECB's plans. Although the bank is expected to keep interest rates high, market participants are eager to hear any updates to economic forecasts and hints from ECB President Christine Lagarde about when borrowing costs might start to decrease.
Recent data showed that inflation in the Eurozone dropped again last month, making it the second month of decline, with a rate of 2.6% in February—a bit higher than the predicted 2.5%. The fundamental inflation rate also fell to 3.1%, above the expected 2.9%. This information suggests that the ECB is careful before reducing monetary policy measures.Though trading on financial markets involves high risk, it can still generate extra income in case you apply the right approach. By choosing a reliable broker such as InstaForex you get access to the international financial markets and open your way towards financial independence. You can sign up here.
-
Senior Member
- Join Date
- Oct 2022
- Posts
- 1,190
- Thanks
- 1
- Thanked 1,564 Times in 522 Posts
RSI Indicator Predicts GBPUSD Bullish Trend Continuation
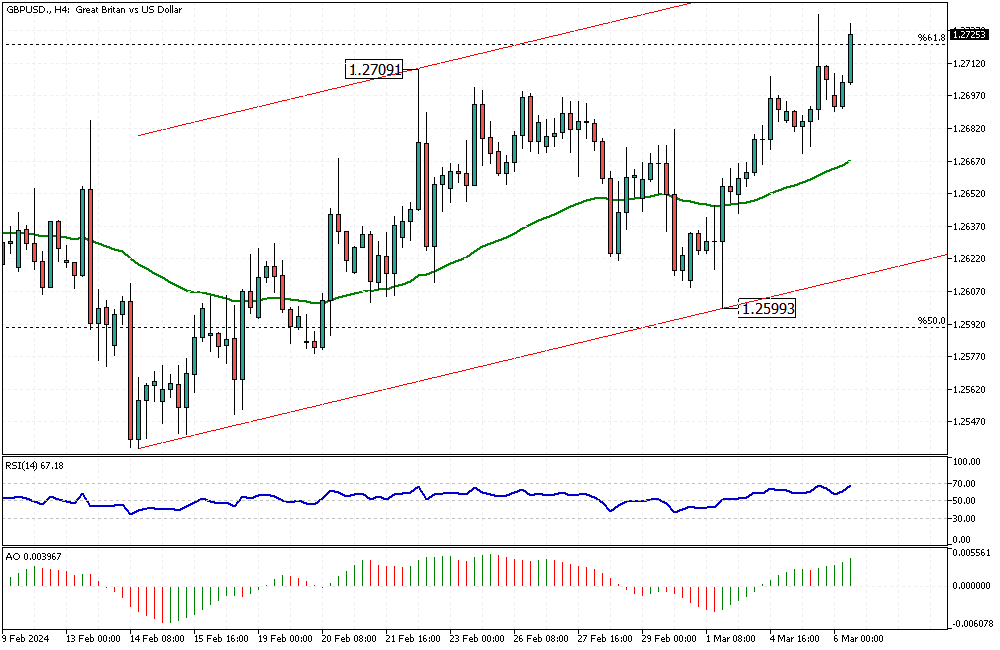
Solid ECN – The GBPUSD currency pair has climbed above 1.2709, exceeding the 61.8% Fibonacci resistance level. RSI and Awesome Oscillator support this rise, which suggests continuing the trend. The RSI has room to reach the 70 level, which can be interpreted as the market not being overbought yet. This indicates that the pound sterling will likely target the bullish channel's upper band against the U.S. dollar.
Please note that the bull market will remain valid if the pair trades above the 50% Fibonacci retracement level.Though trading on financial markets involves high risk, it can still generate extra income in case you apply the right approach. By choosing a reliable broker such as InstaForex you get access to the international financial markets and open your way towards financial independence. You can sign up here.
-
Senior Member
- Join Date
- Oct 2022
- Posts
- 1,190
- Thanks
- 1
- Thanked 1,564 Times in 522 Posts
Enjoy 7 Days of Swap-Free Trading on Major Forex Pairs
Solid ECN – We are pleased to announce a significant update from Solid ECN Securities aimed at optimizing your trading experience. Understanding the importance of cost-effective trading solutions, we have implemented a new feature that exempts swap rates for the major currency pairs for seven trading days.
This update encompasses the major currency pairs, including EUR/USD, USD/JPY, GBP/USD, AUD/USD, USD/CHF, NZD/USD, and USD/CAD, providing a more streamlined trading environment. This initiative is part of our commitment to offer accessible trading conditions to all our clients, irrespective of their geographical location or background. By removing financial barriers, we can foster a more inclusive trading community.
We invite all our customers to use this new feature across all Solid ECN accounts. It is a testament to our ongoing efforts to tailor our services to meet the diverse needs of our clients, enhancing both your trading strategy and potential for success.
For more details on how to benefit from swap-free trading days, please visit our website or contact our support team.
https://solidecn.com >>> %15 Bonus | Swap Free | Raw Spread | RegulatedThough trading on financial markets involves high risk, it can still generate extra income in case you apply the right approach. By choosing a reliable broker such as InstaForex you get access to the international financial markets and open your way towards financial independence. You can sign up here.
-
Senior Member
- Join Date
- Oct 2022
- Posts
- 1,190
- Thanks
- 1
- Thanked 1,564 Times in 522 Posts
Bullish USDJPY Awaits Breakout from Flag Pattern
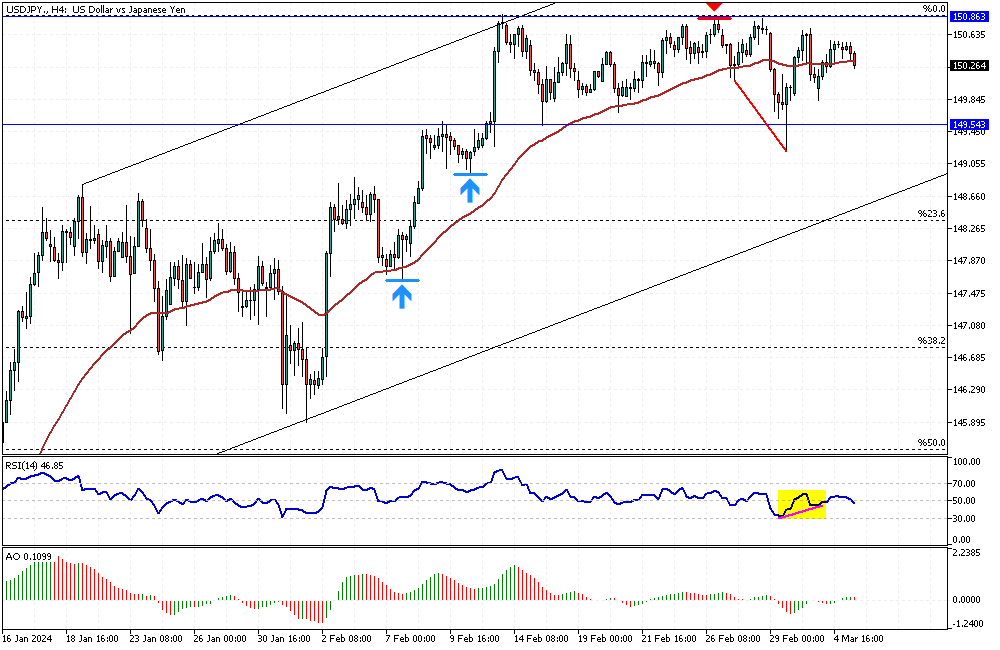
Solid ECN – The USDJPY pair is consolidating in a narrow area between the 149.5 support and 150.8 resistance. The RSI indicator shows divergence, which could be interpreted as a possible trend reversal. However, the decline halted, and the bears could not close below the 149.5 support. Consequently, the price stepped back into the range area.
From a technical standpoint, the primary trend is bullish as long as the pair trades inside the bullish flag and above the 23.6% Fibonacci support. For the uptrend to continue, the price should stabilize itself above 150.8. In this scenario, the pair will likely target the upper band of the flag.
Going short on USDJPY is not recommended, considering the robust bullish bias on the trend direction. Therefore, waiting for a buying opportunity is less risky than going short.Though trading on financial markets involves high risk, it can still generate extra income in case you apply the right approach. By choosing a reliable broker such as InstaForex you get access to the international financial markets and open your way towards financial independence. You can sign up here.
-
Senior Member
- Join Date
- Oct 2022
- Posts
- 1,190
- Thanks
- 1
- Thanked 1,564 Times in 522 Posts
U.S. Oil Technical Analysis
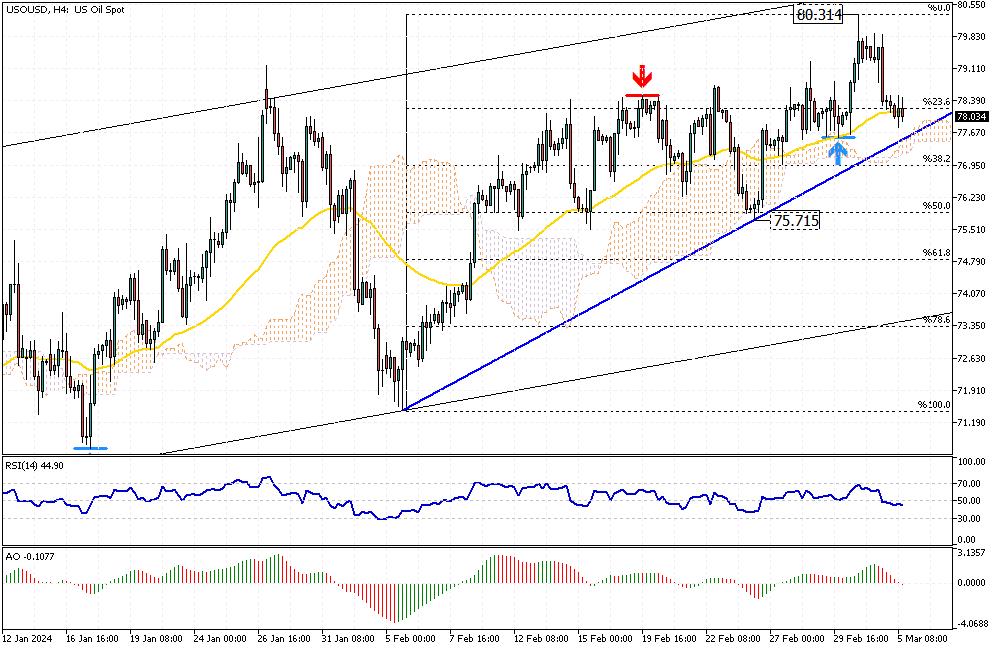
Solid ECN – The U.S. oil price hovers around $78 in today's trading session. The black gold experienced a dip on March 1st after climbing as high as $80 per barrel. The Ichimoku cloud and the ascending trendline have prevented further declines, yet the bear market has not pushed the price down to as low as $77.7.
Technical indicators match the recent price decrease. The RSI indicator and the Awesome Oscillator have dipped below the signal line. From a technical standpoint, the bearish pressure may increase if the price falls below the ascending trendline, depicted in blue.
Conversely, given the primary bullish trend, if the ascending trendline holds steady, the oil price could see a new bullish wave aiming for March's highs, followed by the $82 mark.Though trading on financial markets involves high risk, it can still generate extra income in case you apply the right approach. By choosing a reliable broker such as InstaForex you get access to the international financial markets and open your way towards financial independence. You can sign up here.
-
Senior Member
- Join Date
- Oct 2022
- Posts
- 1,190
- Thanks
- 1
- Thanked 1,564 Times in 522 Posts
AUDUSD Experiences Pullback from Fibonacci Level
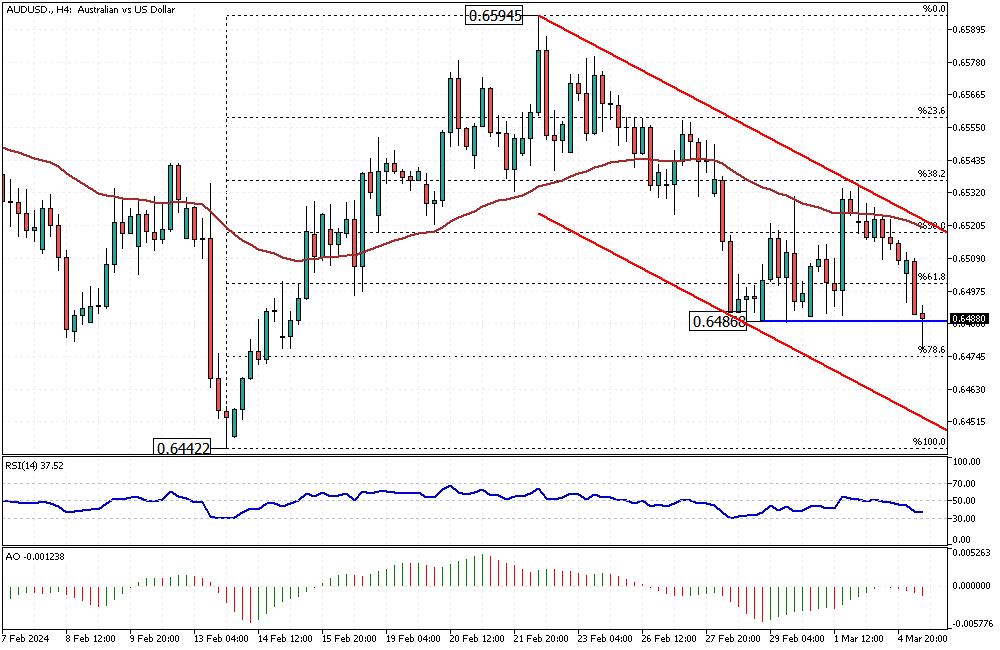
Solid ECN – The Australian dollar has crossed below the 0.648 resistance level against the U.S. Dollar. The pair bounced from the 78.6% Fibonacci support level and is trading at approximately 0.648 at the time of writing. Upon examining the AUDUSD 4-hour chart, we notice that the price is declining within the bearish channel. The technical indicators support the primary trend, with the RSI hovering below 50, and the Awesome Oscillator bars are red and below the signal line.
Currently, the pair is experiencing a pullback from the aforementioned Fibonacci level, which may extend to the 61.8% resistance level, followed by the upper band of the flag.
From a technical standpoint, the AUDUSD is in a bear market, and the downtrend will likely continue. The next target could be 0.6442, the lower low of February.
Conversely, the bear market should be considered invalid if the AUDUSD price rises above 0.6524, above the 50% Fibonacci resistance level.Though trading on financial markets involves high risk, it can still generate extra income in case you apply the right approach. By choosing a reliable broker such as InstaForex you get access to the international financial markets and open your way towards financial independence. You can sign up here.
-
Senior Member
- Join Date
- Oct 2022
- Posts
- 1,190
- Thanks
- 1
- Thanked 1,564 Times in 522 Posts
Bullish Outlook: GBP USD's Potential to Overcome Resistance
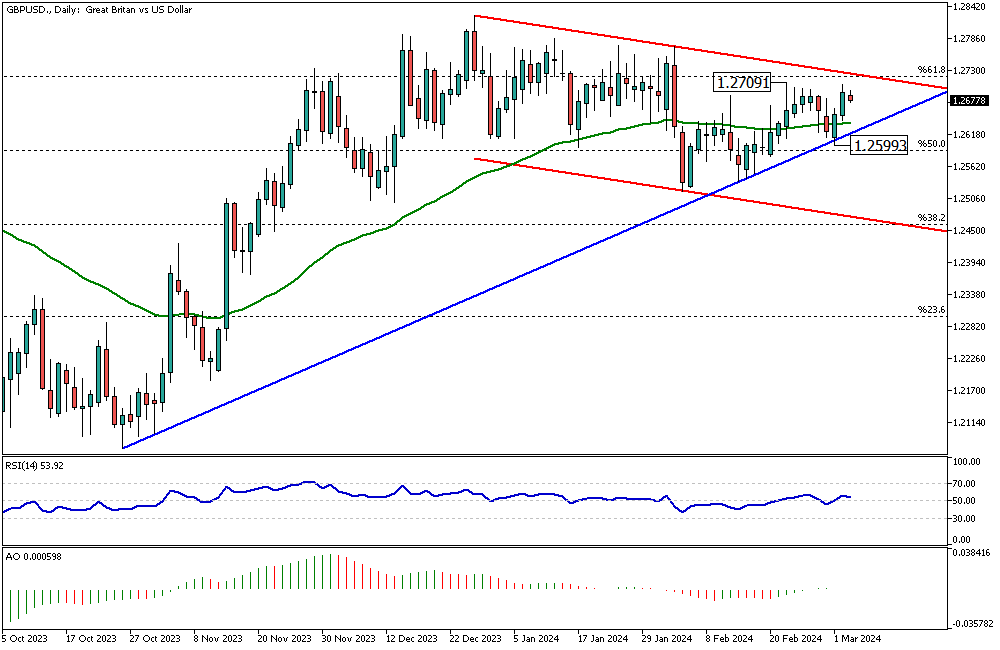
Solid ECN – The pound sterling is stabilizing at around 1.267 against the U.S. dollar, above the 50 EMA but slightly below the 61.8% Fibonacci resistance. The GBPUSD daily chart shows that the pair has traded sideways since mid-November 2023.
While the technical indicators don't provide anything significant, from a technical standpoint, the primary trend is bullish. As long as the pair trades above the ascending trendline, depicted in blue, we expect the market to surpass the 1.270 barrier and aim for the 78.6% Fibonacci resistance.
Conversely, the bearish channel will remain valid if the price falls below the ascending trendline. In this scenario, the next target for the sellers would be the 38.2% Fibonacci level.Though trading on financial markets involves high risk, it can still generate extra income in case you apply the right approach. By choosing a reliable broker such as InstaForex you get access to the international financial markets and open your way towards financial independence. You can sign up here.
-
The Following User Says Thank You to Solid ECN For This Useful Post:
Unregistered (1)
-
Senior Member
- Join Date
- Oct 2022
- Posts
- 1,190
- Thanks
- 1
- Thanked 1,564 Times in 522 Posts
Boost Your Trading with Solid ECN - Enjoy a 15% Deposit Bonus!
Solid ECN – Trading forex and other leveraged products requires having more margin.
At Solid ECN, we've got your back! We offer a 15% boost on your deposits, up to $500 per account. Plus, all profits from your trading can be withdrawn without hassle. Unlike other companies that might remove bonuses during margin calls, our bonus is 100% tradable and can be fully utilized in your trades.
We're taking on 15% more risk to ensure you trade more confidently. Try Solid ECN today and share your trading journey with us!
https://solidecn.com >>> %15 Bonus | Swap Free | Raw Spread | RegulatedThough trading on financial markets involves high risk, it can still generate extra income in case you apply the right approach. By choosing a reliable broker such as InstaForex you get access to the international financial markets and open your way towards financial independence. You can sign up here.
Results 121 to 130 of 1206

 Reply With Quote