 Thread:


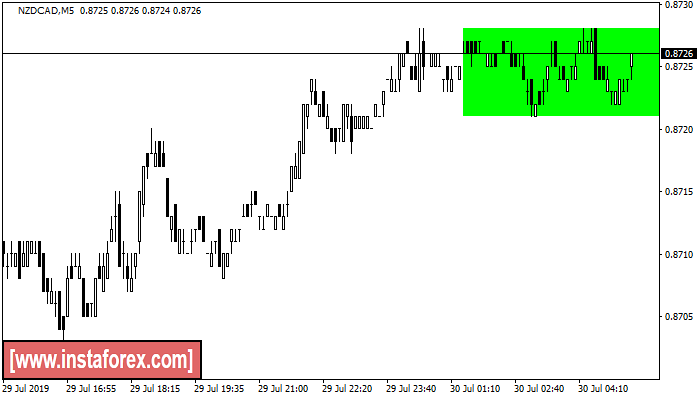
Bearish Rectangle
was formed on 30.07 at 02:17:26 (UTC+0)
signal strength 1 of 5
According to the chart of M5, NZDCAD formed the Bearish Rectangle. The pattern indicates a trend continuation. The upper border is 0.8728, the lower border is 0.8721. The signal means that a long position should be opened above the upper border 0.8728 of the Bearish Rectangle.
The M5 and M15 time frames may have more false entry points.
Malaysia Forex Forum
- Forum
- Forex Charts
- Monitoring
- Forex TV

-
Senior Member


- Join Date
- Apr 2019
- Posts
- 199
- Thanks
- 4
- Thanked 1,902 Times in 198 Posts
"Yang Profit Jadikan Ikutan, Yang Loss Jadikan Pengajaran"
► FREE! SIGNAL INTRADAY DAN SWING Klik!
► FREE! DOWNLOAD INDIKATOR AUTO FIBO Klik!
► FREE! BELAJAR ASAS FOREX BAHASA MELAYU Klik!
► FREE! BONUS $1500 TANPA DEPOSIT Klik!
► FREE! COPY TRADE / PAMM INVESTING Klik!
► INSTAFOREX MALAYSIA Broker Terbaik Asia! :cool:
-
-
Senior Member
- Join Date
- Apr 2019
- Posts
- 199
- Thanks
- 4
- Thanked 1,902 Times in 198 Posts
Double Top
was formed on 30.07 at 02:00:36 (UTC+0)
signal strength 4 of 5
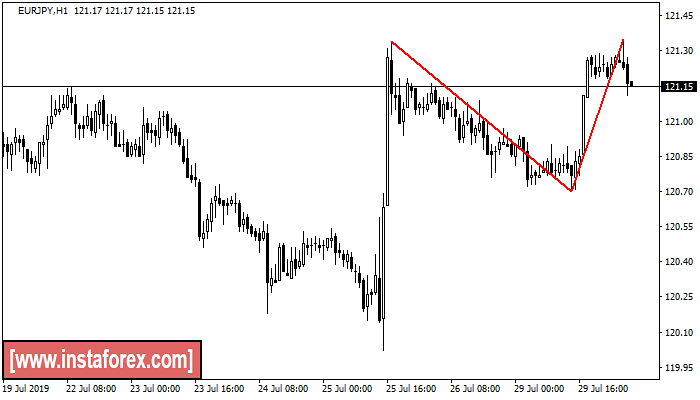
The Double Top reversal pattern has been formed on EURJPY H1. Characteristics: the upper boundary 121.34; the lower boundary 120.70; the width of the pattern is 65 points. Sell trades are better to be opened below the lower boundary 120.70 with a possible movements towards the 120.30 level."Yang Profit Jadikan Ikutan, Yang Loss Jadikan Pengajaran"
► FREE! SIGNAL INTRADAY DAN SWING Klik!
► FREE! DOWNLOAD INDIKATOR AUTO FIBO Klik!
► FREE! BELAJAR ASAS FOREX BAHASA MELAYU Klik!
► FREE! BONUS $1500 TANPA DEPOSIT Klik!
► FREE! COPY TRADE / PAMM INVESTING Klik!
► INSTAFOREX MALAYSIA Broker Terbaik Asia! :cool:
-
-
Senior Member
- Join Date
- Apr 2019
- Posts
- 199
- Thanks
- 4
- Thanked 1,902 Times in 198 Posts
Triple Top
was formed on 30.07 at 00:30:35 (UTC+0)
signal strength 2 of 5
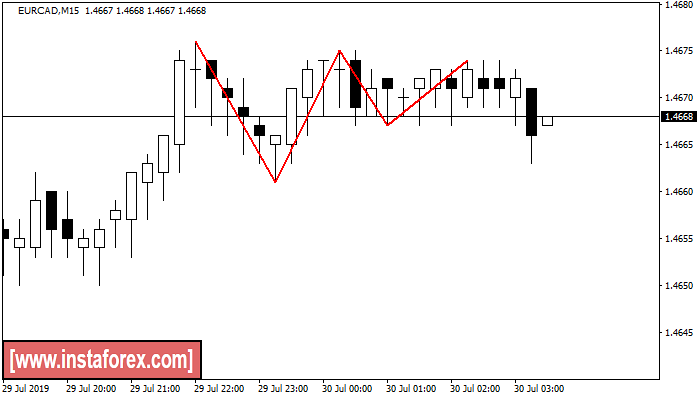
The Triple Top pattern has formed on the chart of the EURCAD M15. Features of the pattern: borders have an ascending angle; the lower line of the pattern has the coordinates 1.4661/1.4667 with the upper limit 1.4676/1.4674; the projection of the width is 15 points. The formation of the Triple Top figure most likely indicates a change in the trend from upward to downward. This means that in the event of a breakdown of the support level of 1.4661, the price is most likely to continue the downward movement.
The M5 and M15 time frames may have more false entry points."Yang Profit Jadikan Ikutan, Yang Loss Jadikan Pengajaran"
► FREE! SIGNAL INTRADAY DAN SWING Klik!
► FREE! DOWNLOAD INDIKATOR AUTO FIBO Klik!
► FREE! BELAJAR ASAS FOREX BAHASA MELAYU Klik!
► FREE! BONUS $1500 TANPA DEPOSIT Klik!
► FREE! COPY TRADE / PAMM INVESTING Klik!
► INSTAFOREX MALAYSIA Broker Terbaik Asia! :cool:
-
-
Senior Member

- Join Date
- Mar 2019
- Posts
- 3,440
- Thanks
- 185
- Thanked 23,445 Times in 2,902 Posts
yang mana suka trade cara pattern boleh la follow thread ni. semoga boleh memberi manfaat kepada semua
Though trading on financial markets involves high risk, it can still generate extra income in case you apply the right approach. By choosing a reliable broker such as InstaForex you get access to the international financial markets and open your way towards financial independence. You can sign up here.
-
The Following 5 Users Say Thank You to Fareez For This Useful Post:
MK Amin (30-07-2019), Unregistered (4)
-
Senior Member
- Join Date
- Apr 2019
- Posts
- 199
- Thanks
- 4
- Thanked 1,902 Times in 198 Posts
Bearish Rectangle
was formed on 29.07 at 03:45:45 (UTC+0)
signal strength 1 of 5
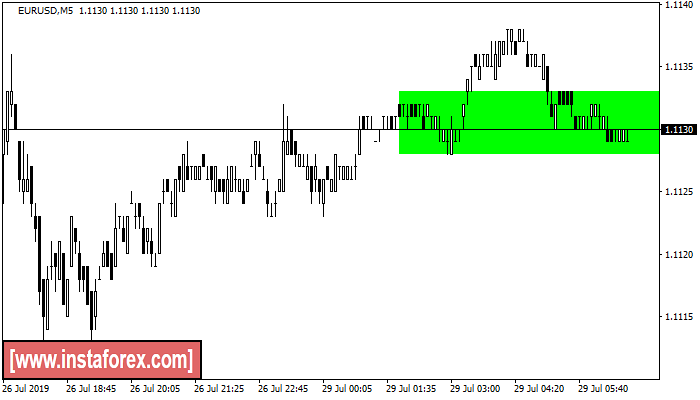
According to the chart of M5, EURUSD formed the Bearish Rectangle. This type of a pattern indicates a trend continuation. It consists of two levels: resistance 1.1133 and support 1.1128. In case the resistance level 1.1133 - 1.1133 is broken, the instrument is likely to follow the bullish trend.
The M5 and M15 time frames may have more false entry points."Yang Profit Jadikan Ikutan, Yang Loss Jadikan Pengajaran"
► FREE! SIGNAL INTRADAY DAN SWING Klik!
► FREE! DOWNLOAD INDIKATOR AUTO FIBO Klik!
► FREE! BELAJAR ASAS FOREX BAHASA MELAYU Klik!
► FREE! BONUS $1500 TANPA DEPOSIT Klik!
► FREE! COPY TRADE / PAMM INVESTING Klik!
► INSTAFOREX MALAYSIA Broker Terbaik Asia! :cool:
-
-
Senior Member
- Join Date
- Apr 2019
- Posts
- 199
- Thanks
- 4
- Thanked 1,902 Times in 198 Posts
Bearish Flag
was formed on 29.07 at 02:31:36 (UTC+0)
signal strength 1 of 5
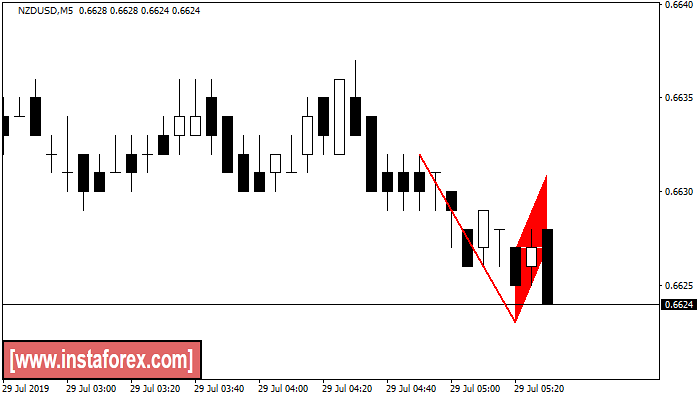
The Bearish Flag pattern has been formed on NZDUSD at M5. The lower boundary of the pattern is located at 0.6623/0.6627 while the upper boundary lies at 0.6627/0.6631. The projection of the flagpole is 9 points. This formation signals that the downward trend is most likely to continue. Therefore, if the level of 0.6623 is broken, the price will move further downwards.
The M5 and M15 time frames may have more false entry points."Yang Profit Jadikan Ikutan, Yang Loss Jadikan Pengajaran"
► FREE! SIGNAL INTRADAY DAN SWING Klik!
► FREE! DOWNLOAD INDIKATOR AUTO FIBO Klik!
► FREE! BELAJAR ASAS FOREX BAHASA MELAYU Klik!
► FREE! BONUS $1500 TANPA DEPOSIT Klik!
► FREE! COPY TRADE / PAMM INVESTING Klik!
► INSTAFOREX MALAYSIA Broker Terbaik Asia! :cool:
-
-
Senior Member
- Join Date
- Apr 2019
- Posts
- 199
- Thanks
- 4
- Thanked 1,902 Times in 198 Posts
Bearish pennant
was formed on 29.07 at 02:31:29 (UTC+0)
signal strength 1 of 5
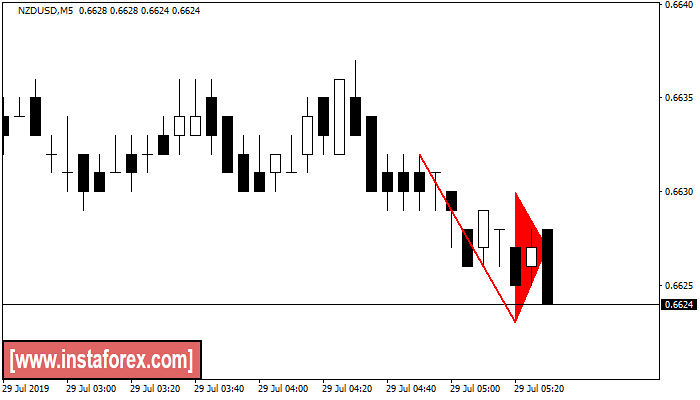
The Bearish pennant pattern has formed on the NZDUSD M5 chart. This pattern type is characterized by a slight slowdown after which the price will move in the direction of the original trend. In case the price fixes below the pattern’s low of 0.6623, a trader will be able to successfully enter the sell position.
The M5 and M15 time frames may have more false entry points."Yang Profit Jadikan Ikutan, Yang Loss Jadikan Pengajaran"
► FREE! SIGNAL INTRADAY DAN SWING Klik!
► FREE! DOWNLOAD INDIKATOR AUTO FIBO Klik!
► FREE! BELAJAR ASAS FOREX BAHASA MELAYU Klik!
► FREE! BONUS $1500 TANPA DEPOSIT Klik!
► FREE! COPY TRADE / PAMM INVESTING Klik!
► INSTAFOREX MALAYSIA Broker Terbaik Asia! :cool:
-
-
Senior Member
- Join Date
- Apr 2019
- Posts
- 199
- Thanks
- 4
- Thanked 1,902 Times in 198 Posts
Bullish symmetrical triangle
was formed on 26.07 at 10:23:43 (UTC+0)
signal strength 1 of 5
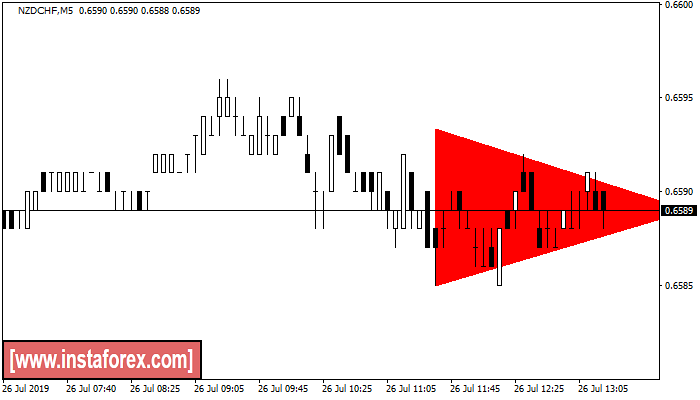
According to the chart of M5, NZDCHF formed the Bullish symmetrical triangle pattern, which signals the trend will continue. Description. The upper border of the pattern touches the coordinates 0.6585/0.6589 whereas the lower border goes across 0.6593/0.6589. The pattern width is measured on the chart at -8 pips. If the Bullish symmetrical triangle pattern is in progress during the upward trend, this indicates the current trend will go on. In case 0.6589 is broken, the price could continue its move toward 0.
The M5 and M15 time frames may have more false entry points.
Open chart in a new windo"Yang Profit Jadikan Ikutan, Yang Loss Jadikan Pengajaran"
► FREE! SIGNAL INTRADAY DAN SWING Klik!
► FREE! DOWNLOAD INDIKATOR AUTO FIBO Klik!
► FREE! BELAJAR ASAS FOREX BAHASA MELAYU Klik!
► FREE! BONUS $1500 TANPA DEPOSIT Klik!
► FREE! COPY TRADE / PAMM INVESTING Klik!
► INSTAFOREX MALAYSIA Broker Terbaik Asia! :cool:
-
-
Senior Member
- Join Date
- Apr 2019
- Posts
- 199
- Thanks
- 4
- Thanked 1,902 Times in 198 Posts
Triple Top
was formed on 26.07 at 10:10:28 (UTC+0)
signal strength 1 of 5
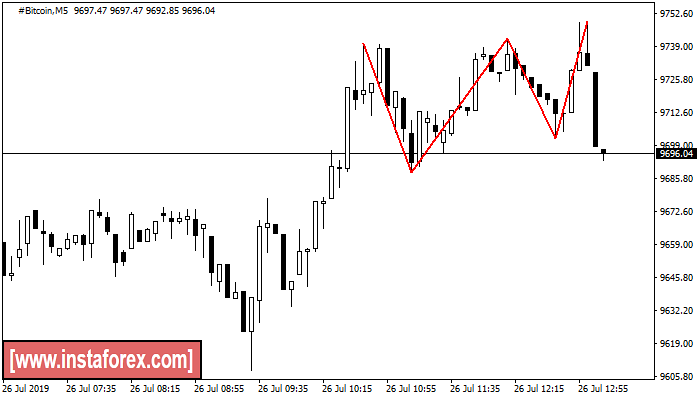
The Triple Top pattern has formed on the chart of the #Bitcoin M5 trading instrument. It is a reversal pattern featuring the following characteristics: resistance level -900, support level -1357, and pattern’s width 5198. Forecast If the price breaks through the support level 9688.32, it is likely to move further down to 9742.32.
The M5 and M15 time frames may have more false entry points."Yang Profit Jadikan Ikutan, Yang Loss Jadikan Pengajaran"
► FREE! SIGNAL INTRADAY DAN SWING Klik!
► FREE! DOWNLOAD INDIKATOR AUTO FIBO Klik!
► FREE! BELAJAR ASAS FOREX BAHASA MELAYU Klik!
► FREE! BONUS $1500 TANPA DEPOSIT Klik!
► FREE! COPY TRADE / PAMM INVESTING Klik!
► INSTAFOREX MALAYSIA Broker Terbaik Asia! :cool:
-
-
Senior Member
- Join Date
- Apr 2019
- Posts
- 199
- Thanks
- 4
- Thanked 1,902 Times in 198 Posts
Inverse Head and Shoulder
was formed on 26.07 at 09:46:09 (UTC+0)
signal strength 2 of 5
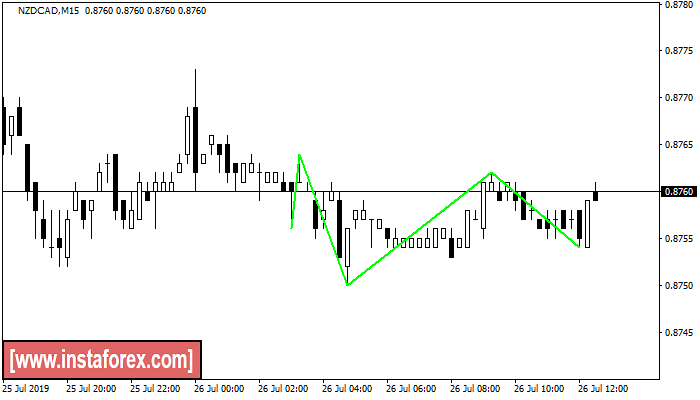
According to M15, NZDCAD is shaping the technical pattern – the Inverse Head and Shoulder. In case the Neckline 0.8764/0.8762 is broken out, the instrument is likely to move toward 0.8784.
The M5 and M15 time frames may have more false entry points."Yang Profit Jadikan Ikutan, Yang Loss Jadikan Pengajaran"
► FREE! SIGNAL INTRADAY DAN SWING Klik!
► FREE! DOWNLOAD INDIKATOR AUTO FIBO Klik!
► FREE! BELAJAR ASAS FOREX BAHASA MELAYU Klik!
► FREE! BONUS $1500 TANPA DEPOSIT Klik!
► FREE! COPY TRADE / PAMM INVESTING Klik!
► INSTAFOREX MALAYSIA Broker Terbaik Asia! :cool:
-
Results 11 to 20 of 160

 Reply With Quote