 Thread:


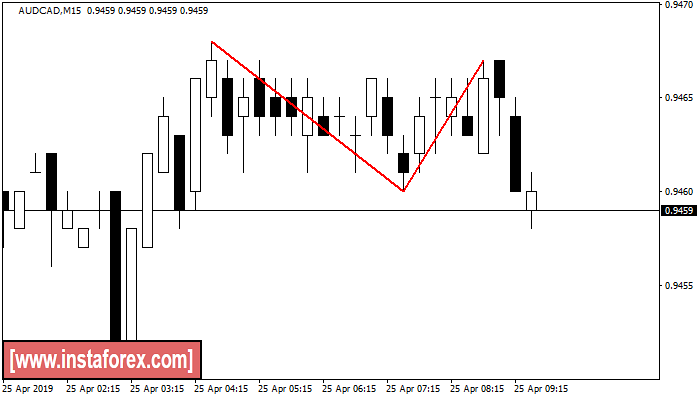
Double Top
was formed on 25.04 at 06:45:10 (UTC+0)
signal strength 2 of 5
The Double Top pattern has been formed on AUDCAD M15. It signals that the trend has been changed from upwards to downwards. Probably, if the base of the pattern 0.9460 is broken, the downward movement will continue.
The M5 and M15 time frames may have more false entry points.
Malaysia Forex Forum
- Forum
- Forex Charts
- Monitoring
- Forex TV

-
Senior Member


- Join Date
- Apr 2019
- Posts
- 199
- Thanks
- 4
- Thanked 1,903 Times in 198 Posts
"Yang Profit Jadikan Ikutan, Yang Loss Jadikan Pengajaran"
► FREE! SIGNAL INTRADAY DAN SWING Klik!
► FREE! DOWNLOAD INDIKATOR AUTO FIBO Klik!
► FREE! BELAJAR ASAS FOREX BAHASA MELAYU Klik!
► FREE! BONUS $1500 TANPA DEPOSIT Klik!
► FREE! COPY TRADE / PAMM INVESTING Klik!
► INSTAFOREX MALAYSIA Broker Terbaik Asia! :cool:
-
-
Senior Member
- Join Date
- Apr 2019
- Posts
- 199
- Thanks
- 4
- Thanked 1,903 Times in 198 Posts
Bearish Symmetrical Triangle
was formed on 25.04 at 06:15:31 (UTC+0)
signal strength 1 of 5
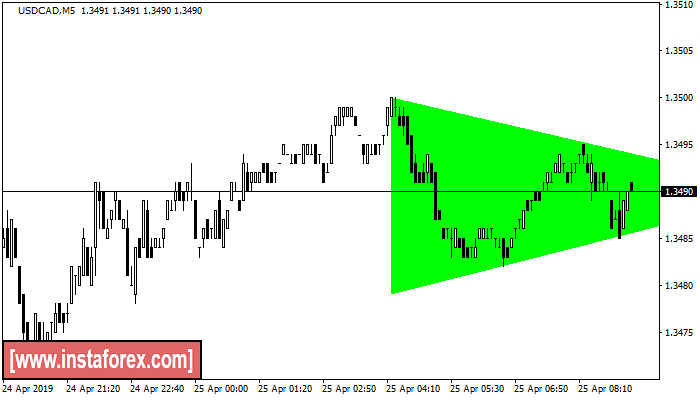
According to the chart of M5, USDCAD formed the Bearish Symmetrical Triangle pattern. Description: The lower border is 1.3500/1.3490 and upper border is 1.3479/1.3490. The pattern width is measured on the chart at 21 pips. The formation of the Bearish Symmetrical Triangle pattern evidently signals a continuation of the downward trend. In other words, if the scenario comes true and USDCAD breaches the lower border, the price could continue its move toward 1.
The M5 and M15 time frames may have more false entry points."Yang Profit Jadikan Ikutan, Yang Loss Jadikan Pengajaran"
► FREE! SIGNAL INTRADAY DAN SWING Klik!
► FREE! DOWNLOAD INDIKATOR AUTO FIBO Klik!
► FREE! BELAJAR ASAS FOREX BAHASA MELAYU Klik!
► FREE! BONUS $1500 TANPA DEPOSIT Klik!
► FREE! COPY TRADE / PAMM INVESTING Klik!
► INSTAFOREX MALAYSIA Broker Terbaik Asia! :cool:
-
-
Senior Member
- Join Date
- Apr 2019
- Posts
- 199
- Thanks
- 4
- Thanked 1,903 Times in 198 Posts
Bearish Rectangle
was formed on 25.04 at 05:57:28 (UTC+0)
signal strength 1 of 5
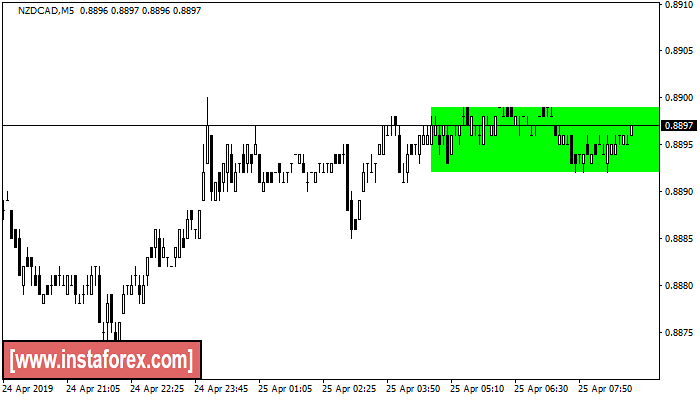
According to the chart of M5, NZDCAD formed the Bearish Rectangle. This type of a pattern indicates a trend continuation. It consists of two levels: resistance 0.8899 and support 0.8892. In case the resistance level 0.8899 - 0.8899 is broken, the instrument is likely to follow the bullish trend.
The M5 and M15 time frames may have more false entry points."Yang Profit Jadikan Ikutan, Yang Loss Jadikan Pengajaran"
► FREE! SIGNAL INTRADAY DAN SWING Klik!
► FREE! DOWNLOAD INDIKATOR AUTO FIBO Klik!
► FREE! BELAJAR ASAS FOREX BAHASA MELAYU Klik!
► FREE! BONUS $1500 TANPA DEPOSIT Klik!
► FREE! COPY TRADE / PAMM INVESTING Klik!
► INSTAFOREX MALAYSIA Broker Terbaik Asia! :cool:
-
-
Senior Member
- Join Date
- Apr 2019
- Posts
- 199
- Thanks
- 4
- Thanked 1,903 Times in 198 Posts
Bearish Symmetrical Triangle
was formed on 25.04 at 05:37:14 (UTC+0)
signal strength 1 of 5
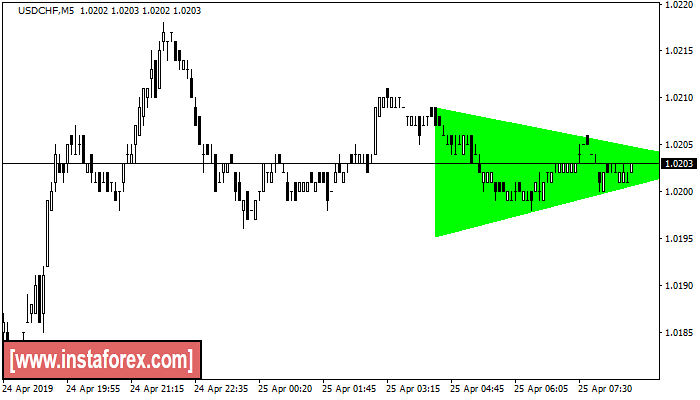
According to the chart of M5, USDCHF formed the Bearish Symmetrical Triangle pattern. Description: The lower border is 1.0209/1.0203 and upper border is 1.0195/1.0203. The pattern width is measured on the chart at 14 pips. The formation of the Bearish Symmetrical Triangle pattern evidently signals a continuation of the downward trend. In other words, if the scenario comes true and USDCHF breaches the lower border, the price could continue its move toward 1.
The M5 and M15 time frames may have more false entry points."Yang Profit Jadikan Ikutan, Yang Loss Jadikan Pengajaran"
► FREE! SIGNAL INTRADAY DAN SWING Klik!
► FREE! DOWNLOAD INDIKATOR AUTO FIBO Klik!
► FREE! BELAJAR ASAS FOREX BAHASA MELAYU Klik!
► FREE! BONUS $1500 TANPA DEPOSIT Klik!
► FREE! COPY TRADE / PAMM INVESTING Klik!
► INSTAFOREX MALAYSIA Broker Terbaik Asia! :cool:
-
-
Senior Member
- Join Date
- Apr 2019
- Posts
- 199
- Thanks
- 4
- Thanked 1,903 Times in 198 Posts
Bearish Rectangle
was formed on 25.04 at 05:26:33 (UTC+0)
signal strength 1 of 5
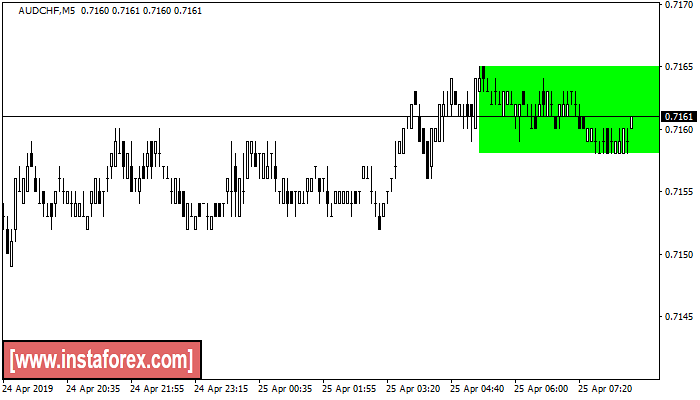
According to the chart of M5, AUDCHF formed the Bearish Rectangle. This type of a pattern indicates a trend continuation. It consists of two levels: resistance 0.7165 and support 0.7158. In case the resistance level 0.7165 - 0.7165 is broken, the instrument is likely to follow the bullish trend.
The M5 and M15 time frames may have more false entry points."Yang Profit Jadikan Ikutan, Yang Loss Jadikan Pengajaran"
► FREE! SIGNAL INTRADAY DAN SWING Klik!
► FREE! DOWNLOAD INDIKATOR AUTO FIBO Klik!
► FREE! BELAJAR ASAS FOREX BAHASA MELAYU Klik!
► FREE! BONUS $1500 TANPA DEPOSIT Klik!
► FREE! COPY TRADE / PAMM INVESTING Klik!
► INSTAFOREX MALAYSIA Broker Terbaik Asia! :cool:
-
-
Senior Member
- Join Date
- Apr 2019
- Posts
- 199
- Thanks
- 4
- Thanked 1,903 Times in 198 Posts
Bullish symmetrical triangle
was formed on 25.04 at 04:44:13 (UTC+0)
signal strength 3 of 5
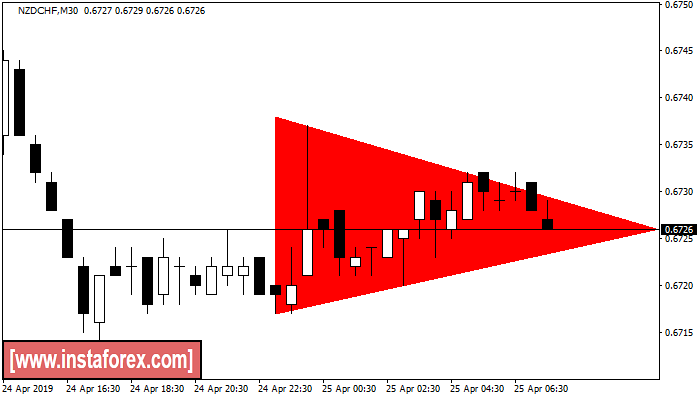
According to the chart of M30, NZDCHF formed the Bullish symmetrical triangle pattern, which signals the trend will continue. Description. The upper border of the pattern touches the coordinates 0.6717/0.6726 whereas the lower border goes across 0.6738/0.6726. The pattern width is measured on the chart at -21 pips. If the Bullish symmetrical triangle pattern is in progress during the upward trend, this indicates the current trend will go on. In case 0.6726 is broken, the price could continue its move toward 0."Yang Profit Jadikan Ikutan, Yang Loss Jadikan Pengajaran"
► FREE! SIGNAL INTRADAY DAN SWING Klik!
► FREE! DOWNLOAD INDIKATOR AUTO FIBO Klik!
► FREE! BELAJAR ASAS FOREX BAHASA MELAYU Klik!
► FREE! BONUS $1500 TANPA DEPOSIT Klik!
► FREE! COPY TRADE / PAMM INVESTING Klik!
► INSTAFOREX MALAYSIA Broker Terbaik Asia! :cool:
-
-
Senior Member
- Join Date
- Apr 2019
- Posts
- 199
- Thanks
- 4
- Thanked 1,903 Times in 198 Posts
Inverse Head and Shoulder
was formed on 25.04 at 03:30:45 (UTC+0)
signal strength 1 of 5

According to the chart of M5, EURJPY produced the pattern termed the Inverse Head and Shoulder. The Head is fixed at 124.87 while the median line of the Neck is set at 125.05/125.03. The formation of the Inverse Head and Shoulder Pattern clearly indicates a reversal of the downward trend. In means that in case the scenario comes true, the price of EURJPY will go towards 125.18.
The M5 and M15 time frames may have more false entry points."Yang Profit Jadikan Ikutan, Yang Loss Jadikan Pengajaran"
► FREE! SIGNAL INTRADAY DAN SWING Klik!
► FREE! DOWNLOAD INDIKATOR AUTO FIBO Klik!
► FREE! BELAJAR ASAS FOREX BAHASA MELAYU Klik!
► FREE! BONUS $1500 TANPA DEPOSIT Klik!
► FREE! COPY TRADE / PAMM INVESTING Klik!
► INSTAFOREX MALAYSIA Broker Terbaik Asia! :cool:
-
-
Senior Member
- Join Date
- Apr 2019
- Posts
- 199
- Thanks
- 4
- Thanked 1,903 Times in 198 Posts
Inverse Head and Shoulder
was formed on 25.04 at 03:06:56 (UTC+0)
signal strength 1 of 5
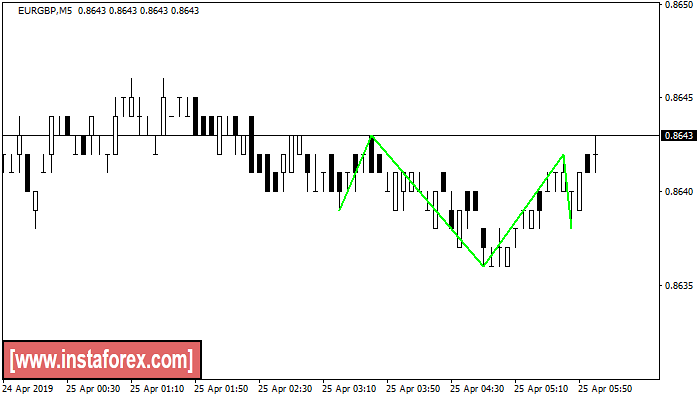
According to M5, EURGBP is shaping the technical pattern – the Inverse Head and Shoulder. In case the Neckline 0.8643/0.8642 is broken out, the instrument is likely to move toward 0.8657.
The M5 and M15 time frames may have more false entry points."Yang Profit Jadikan Ikutan, Yang Loss Jadikan Pengajaran"
► FREE! SIGNAL INTRADAY DAN SWING Klik!
► FREE! DOWNLOAD INDIKATOR AUTO FIBO Klik!
► FREE! BELAJAR ASAS FOREX BAHASA MELAYU Klik!
► FREE! BONUS $1500 TANPA DEPOSIT Klik!
► FREE! COPY TRADE / PAMM INVESTING Klik!
► INSTAFOREX MALAYSIA Broker Terbaik Asia! :cool:
-
-
Senior Member
- Join Date
- Apr 2019
- Posts
- 199
- Thanks
- 4
- Thanked 1,903 Times in 198 Posts
Triple Bottom
was formed on 25.04 at 02:22:02 (UTC+0)
signal strength 2 of 5
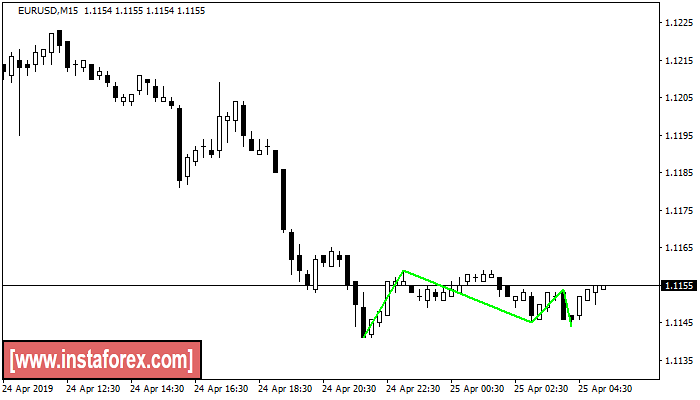
The Triple Bottom pattern has been formed on EURUSD M15. It has the following characteristics: resistance level 1.1159/1.1154; support level 1.1141/1.1144; the width is 18 points. In the event of a breakdown of the resistance level of 1.1159, the price is likely to continue an upward movement at least to 1.1168.
The M5 and M15 time frames may have more false entry points."Yang Profit Jadikan Ikutan, Yang Loss Jadikan Pengajaran"
► FREE! SIGNAL INTRADAY DAN SWING Klik!
► FREE! DOWNLOAD INDIKATOR AUTO FIBO Klik!
► FREE! BELAJAR ASAS FOREX BAHASA MELAYU Klik!
► FREE! BONUS $1500 TANPA DEPOSIT Klik!
► FREE! COPY TRADE / PAMM INVESTING Klik!
► INSTAFOREX MALAYSIA Broker Terbaik Asia! :cool:
-
-
Senior Member
- Join Date
- Apr 2019
- Posts
- 199
- Thanks
- 4
- Thanked 1,903 Times in 198 Posts
Double Bottom
was formed on 25.04 at 02:18:21 (UTC+0)
signal strength 2 of 5
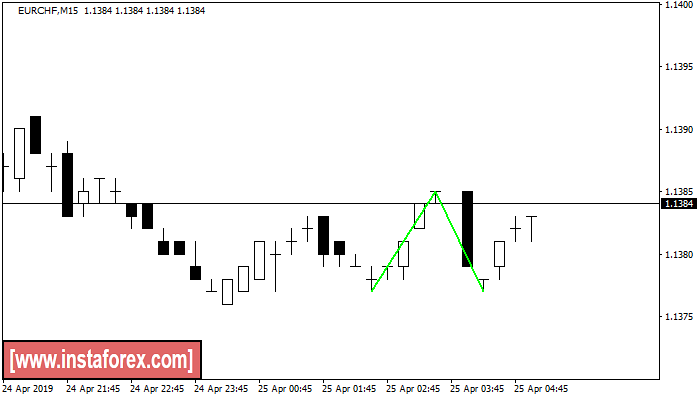
The Double Bottom pattern has been formed on EURCHF M15; the upper boundary is 1.1385; the lower boundary is 1.1377. The width of the pattern is 8 points. In case of a break of the upper boundary 1.1385, a change in the trend can be predicted where the width of the pattern will coincide with the distance to a possible take profit level.
The M5 and M15 time frames may have more false entry points."Yang Profit Jadikan Ikutan, Yang Loss Jadikan Pengajaran"
► FREE! SIGNAL INTRADAY DAN SWING Klik!
► FREE! DOWNLOAD INDIKATOR AUTO FIBO Klik!
► FREE! BELAJAR ASAS FOREX BAHASA MELAYU Klik!
► FREE! BONUS $1500 TANPA DEPOSIT Klik!
► FREE! COPY TRADE / PAMM INVESTING Klik!
► INSTAFOREX MALAYSIA Broker Terbaik Asia! :cool:
-
Results 101 to 110 of 160

 Reply With Quote