 Thread:


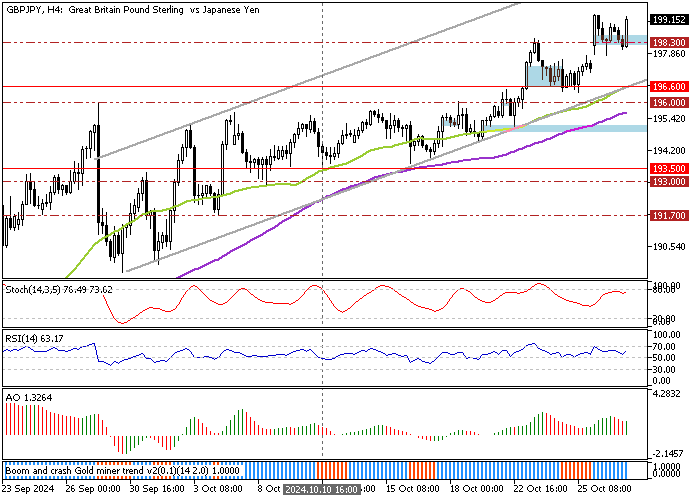
GBP/JPY Signals Strength Above Key Support Levels
FxNews.me—GBP/JPY bounced from the 198.3 Fair Value Gap area, which is a strong bullish signal, considering the primary trend is bullish with the price being above the 50- and 100-period simple moving averages.
The momentum indicators are not overbought, and the Awesome Oscillator histogram turned green, suggesting the uptrend should resume.
Critical support that divided the bull market from the bear market stands at 196.6, backed by the 50-period simple moving average. As long as the price holds above the 196.6 mark, the outlook for the GBP/JPY currency pair remains bullish.
In this scenario, the next target will likely be the 201.0 mark.
Malaysia Forex Forum
- Forum
- Forex Charts
- Monitoring
- Forex TV

-
Senior Member


- Join Date
- Sep 2024
- Posts
- 567
- Thanks
- 0
- Thanked 2,371 Times in 388 Posts
Though trading on financial markets involves high risk, it can still generate extra income in case you apply the right approach. By choosing a reliable broker such as InstaForex you get access to the international financial markets and open your way towards financial independence. You can sign up here.
-
Senior Member
- Join Date
- Sep 2024
- Posts
- 567
- Thanks
- 0
- Thanked 2,371 Times in 388 Posts
EUR/USD Set to Drop as Bearish Pattern Forms
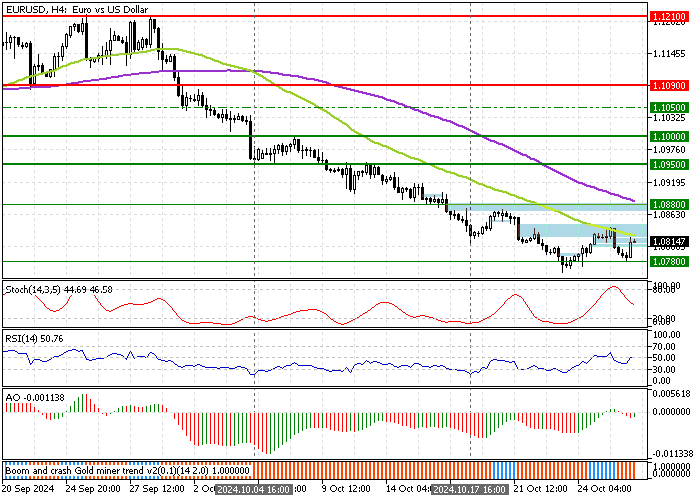
FxNews.me—The EUR/USD currency pair formed a bearish engulfing pattern close to the 50-period simple moving average. Meanwhile, the immediate support rests at $1.078. From a technical perspective, the downtrend will likely resume, with the next target at $1.072 if bears stabilize the price below the immediate support.
Furthermore, the bearish outlook should be invalidated if the EUR/USD price exceeds the critical resistance level of $1.088.Though trading on financial markets involves high risk, it can still generate extra income in case you apply the right approach. By choosing a reliable broker such as InstaForex you get access to the international financial markets and open your way towards financial independence. You can sign up here.
-
Senior Member
- Join Date
- Sep 2024
- Posts
- 567
- Thanks
- 0
- Thanked 2,371 Times in 388 Posts
Bitcoin Eyes $68,750: Bullish Momentum Grows
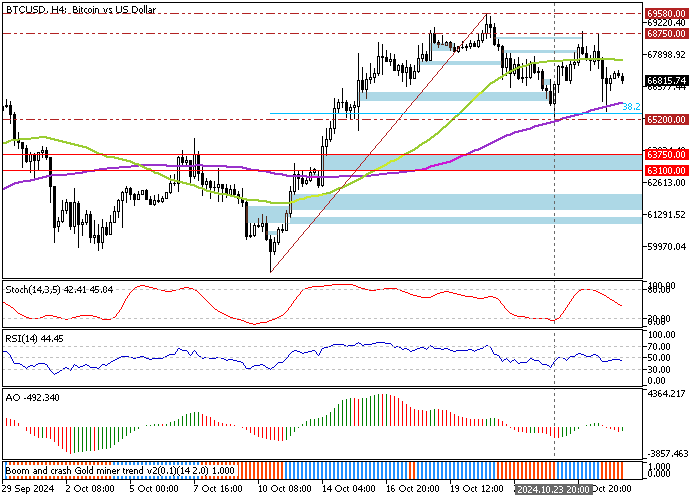
FxNews.me—Bitcoin is trading around $66,800, holding above the 100-period simple moving average (SMA) and the critical support level of $65,200.
Technical indicators suggest a mildly bearish trend, with both the Stochastic and RSI 14 declining. However, the Awesome Oscillator’s histogram has turned green, indicating bullish momentum is gaining strength. In addition to the signal from the Awesome Oscillator, the 4-hour chart shows a long-wick bullish candlestick pattern.
Technically, if Bitcoin stays above the 100-period SMA, the bullish move may target $68,750, followed by the $69,580 resistance level.
However, this bullish outlook becomes invalid if the price drops below $65,200.Though trading on financial markets involves high risk, it can still generate extra income in case you apply the right approach. By choosing a reliable broker such as InstaForex you get access to the international financial markets and open your way towards financial independence. You can sign up here.
-
Senior Member
- Join Date
- Sep 2024
- Posts
- 567
- Thanks
- 0
- Thanked 2,371 Times in 388 Posts
Ethereum Eyes $2,590: Can Bulls Hold $2,505 Support?
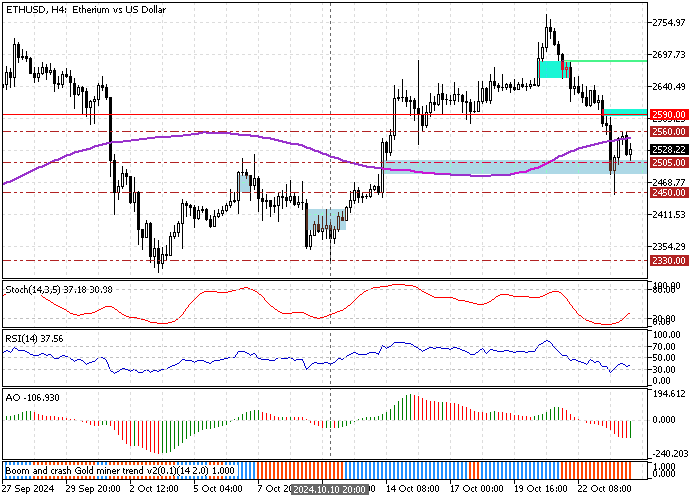
FxNews.me—Ethereum price rebounded from $2,450, the September 14 high. However, the uptick momentum eased when the price hit the 100-period SMA as resistance.
The technical indicators show signs of a bullish trend, with both the Stochastic and RSI 14 rising from the oversold territory. Meanwhile, the Awesome Oscillator histogram has turned green, which is interpreted as a sign that the bull market is strengthening.
Immediate support is at $2,505. The current uptick momentum has the potential to fill the Fair Value Gap at $2,590, provided the bulls maintain their position above the immediate support.
Conversely, the bullish outlook will be invalidated if ETH/USD dips below the $2,505 mark. In this scenario, Ethereum will likely revisit $2,459, and if the selling pressure increases, the downtrend could extend to the October 10 low at $2,330.Though trading on financial markets involves high risk, it can still generate extra income in case you apply the right approach. By choosing a reliable broker such as InstaForex you get access to the international financial markets and open your way towards financial independence. You can sign up here.
-
Senior Member
- Join Date
- Sep 2024
- Posts
- 567
- Thanks
- 0
- Thanked 2,371 Times in 388 Posts
Gold Rebounds: Opportunities for Bullish Traders
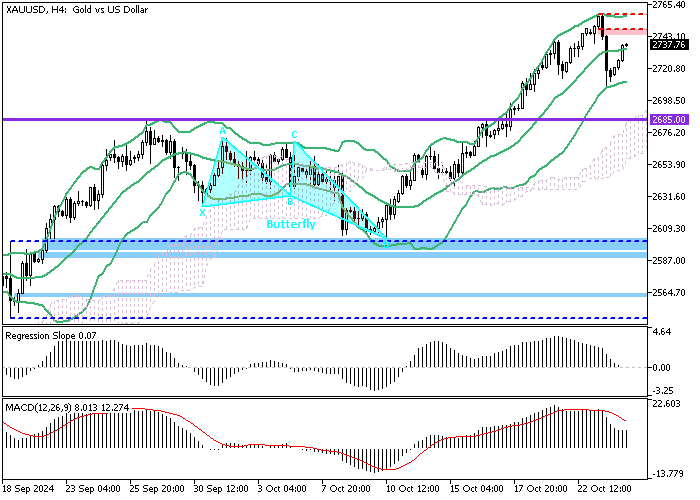
FxNews.me—Gold has resumed its upward trend following a brief consolidation near the 50-period simple moving average. Technical indicators like the RSI 14 and Awesome Oscillator suggest that the bullish momentum is likely to continue.
The immediate resistance level is at $2,685, and there’s potential for the yellow metal to surge further, targeting the Fair Value Gap (marked in red). If this gap holds, gold may retest the $2,685 level, offering traders a good opportunity to enter the bullish market.
However, it’s important to note that gold is currently overvalued in the short term, and a significant decline could occur at any moment. Traders should closely monitor key support levels to find low-risk entry points.Though trading on financial markets involves high risk, it can still generate extra income in case you apply the right approach. By choosing a reliable broker such as InstaForex you get access to the international financial markets and open your way towards financial independence. You can sign up here.
-
Senior Member
- Join Date
- Sep 2024
- Posts
- 567
- Thanks
- 0
- Thanked 2,371 Times in 388 Posts
Bearish Outlook for AUD/USD with Key Levels in Focus
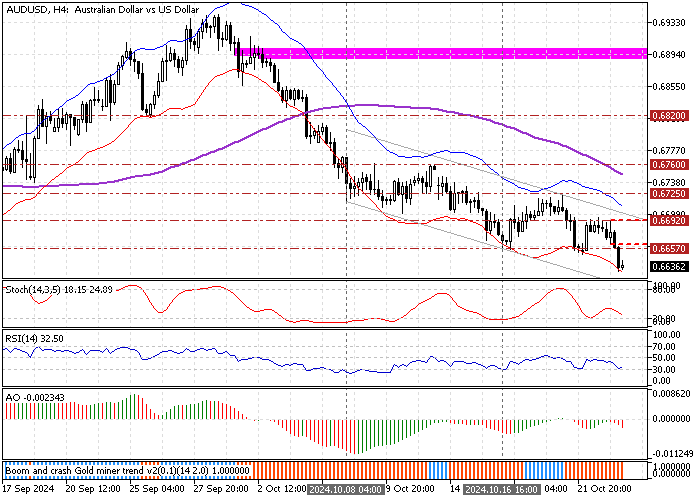
FxNews.me—AUD/USD formed a bearish Fair Value Gap (FVG) after the price broke below the $0.665 support level, signaling a potential continuation of the downtrend. Momentum indicators are not yet in oversold territory, suggesting the price still has room for further decline.
Given the formation of the FVG, the Australian dollar may temporarily recover some of its losses near the upper band of the bearish flag before the downtrend resumes.
Furthermore, the next bearish target could be the $0.656 support, provided the critical resistance at $0.669 holds. However, this bearish outlook would be invalidated if AUD/USD breaks above the critical resistance level.Though trading on financial markets involves high risk, it can still generate extra income in case you apply the right approach. By choosing a reliable broker such as InstaForex you get access to the international financial markets and open your way towards financial independence. You can sign up here.
-
Senior Member
- Join Date
- Sep 2024
- Posts
- 567
- Thanks
- 0
- Thanked 2,371 Times in 388 Posts
Will Solana Bounce Back Above $171.7? Key Levels to Watch
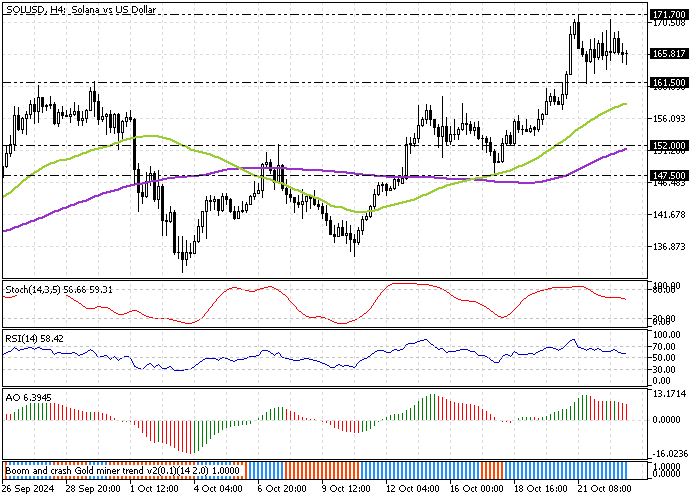
FxNews.me—Solana consolidates below the $171.7 high as expected because the Stochastic and RSI 14 signaled overbought at the time. As of this writing, SOL/USD trades at approximately $165.6, testing the median line of the Bollinger Bands.
The primary trend should be considered bullish because the price is above the 50- and 100-period simple moving averages. However, the Awesome Oscillator histogram is red, signaling that the downtick momentum from $171.7 could extend to the lower support levels.
Forecast
From a technical perspective, the trend outlook remains bullish as long as Solana trades above $161.5. However, for the uptrend to resume, the Bulls must close and stabilize the price above $171.7.
Conversely, a dip below the $161.5 should invalidate the bullish outlook. In this scenario, a new bearish wave will likely form, and the target could be the 100-period SMA at $152.0.Though trading on financial markets involves high risk, it can still generate extra income in case you apply the right approach. By choosing a reliable broker such as InstaForex you get access to the international financial markets and open your way towards financial independence. You can sign up here.
-
Senior Member
- Join Date
- Sep 2024
- Posts
- 567
- Thanks
- 0
- Thanked 2,371 Times in 388 Posts
Ripple's Fall Below $0.54 Signals More Drops
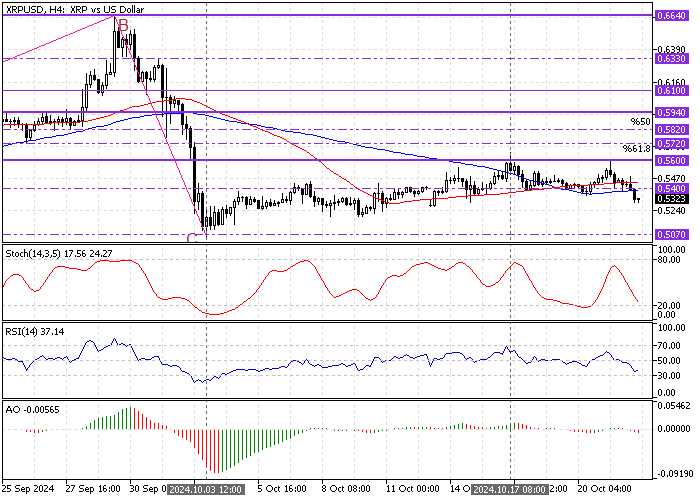
FxNews.me—The Ripple (XRP) bulls failed to surpass the $0.56 resistance. Consequently, the price dipped below the $0.54 immediate support. As a result, the downtrend resumed, with the critical resistance remaining valid at the October 17 high.
The technical indicators suggest the downtrend should resume. In this scenario, the XRP/USD price will likely revisit the October 3 low at $0.507.
The bearish outlook should be invalidated if XRP exceeds $0.5600.Though trading on financial markets involves high risk, it can still generate extra income in case you apply the right approach. By choosing a reliable broker such as InstaForex you get access to the international financial markets and open your way towards financial independence. You can sign up here.
-
Senior Member
- Join Date
- Sep 2024
- Posts
- 567
- Thanks
- 0
- Thanked 2,371 Times in 388 Posts
Oversold Litecoin Prepares for Bearish Wave or Rebound
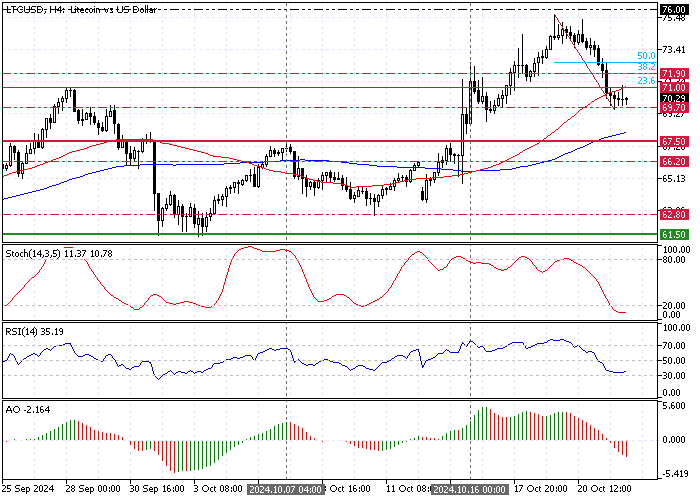
FxNews.me—Litecoin stabilized the price below the critical $71 support, backed by the 5-period simple moving averages. However, the robust selling pressure from $76.0 drove the Stochastic Oscillator into oversold territory, meaning the U.S. Dollar is overpriced.
Hence, the Litecoin price is expected to consolidate around the 50-period SMA before the downtrend resumes. The consolidation ranges from the $69.7 immediate support to the %38.2 Fibonacci retracement level at $71.9 critical resistance.
Please note that a new bearish wave will likely be started if bears break today's low, the $69.7 support below. In this scenario, the next bearish target could be the October 7 high, the $67.5 support.
P.S. The bearish outlook should be invalidated if LTC/USD exceeds the %38.2 Fibonacci retracement level at $71.9.Though trading on financial markets involves high risk, it can still generate extra income in case you apply the right approach. By choosing a reliable broker such as InstaForex you get access to the international financial markets and open your way towards financial independence. You can sign up here.
-
Senior Member
- Join Date
- Sep 2024
- Posts
- 567
- Thanks
- 0
- Thanked 2,371 Times in 388 Posts
Ethereum Tests Key Fibonacci Level at $2,665
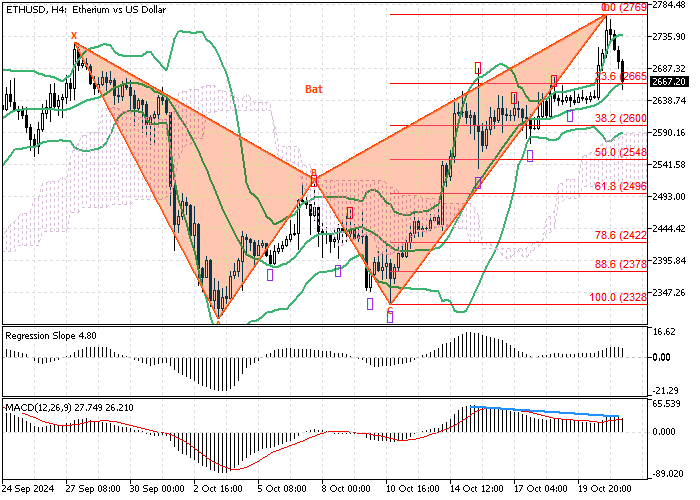
FxNews.me—The 4-hour Ethereum chart formed a Bat harmonic pattern, backed by MACD's divergence signal, which resulted in the price dipping from $2,770. As of this writing, ETH/USD is testing the 23.6% Fibonacci retracement level at $2,665.
From a technical perspective, the consolidation phase will likely extend to the 38.2% Fibonacci level at $2,600 if ETH/USD stabilizes below the 23.6% level. Notably, the Ichimoku Cloud supports the 38.2% Fibonacci level, a significant supply zone for entering the bull market.
Therefore, traders should closely monitor the $2,600 mark for bullish candlestick patterns.Though trading on financial markets involves high risk, it can still generate extra income in case you apply the right approach. By choosing a reliable broker such as InstaForex you get access to the international financial markets and open your way towards financial independence. You can sign up here.
Results 171 to 180 of 228

 Reply With Quote