 Thread:


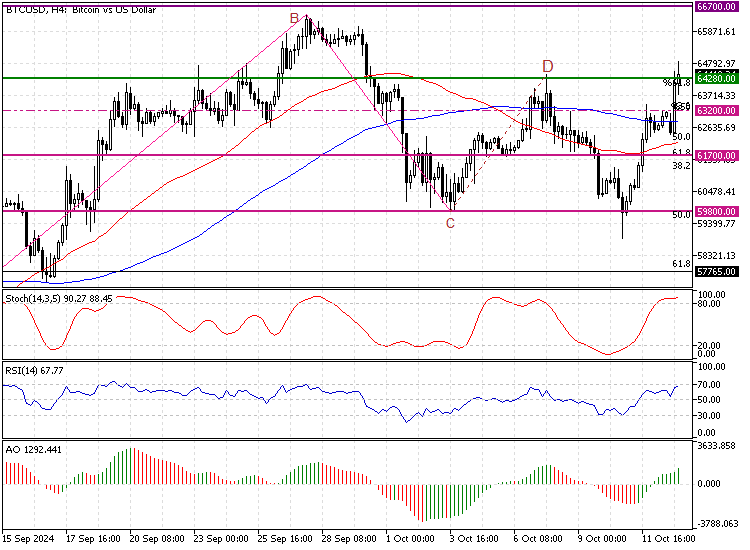
Bitcoin Hits $64,280, Now Overbought: Caution Advised
FxNews.me—Bitcoin's rebound from $59,800 resulted in the bulls hitting $64,280. The robust buying pressure drove Stochastic into overbought territory, signaling that BTCUSD is overbought in the short term. Going long in an overbought market is not advisable; therefore, traders and investors should consider waiting patiently for the market to consolidate and fill previous gaps.
That being said, the price can potentially consolidate near $63,200 before the uptrend resumes. This level provides a solid entry point to join the bull market.
Malaysia Forex Forum
- Forum
- Forex Charts
- Monitoring
- Forex TV

-
Senior Member


- Join Date
- Sep 2024
- Posts
- 567
- Thanks
- 0
- Thanked 2,371 Times in 388 Posts
Though trading on financial markets involves high risk, it can still generate extra income in case you apply the right approach. By choosing a reliable broker such as InstaForex you get access to the international financial markets and open your way towards financial independence. You can sign up here.
-
Senior Member
- Join Date
- Sep 2024
- Posts
- 567
- Thanks
- 0
- Thanked 2,371 Times in 388 Posts
USD/CHF Stabilizes above 50-SMA as Indicators Signal Shift
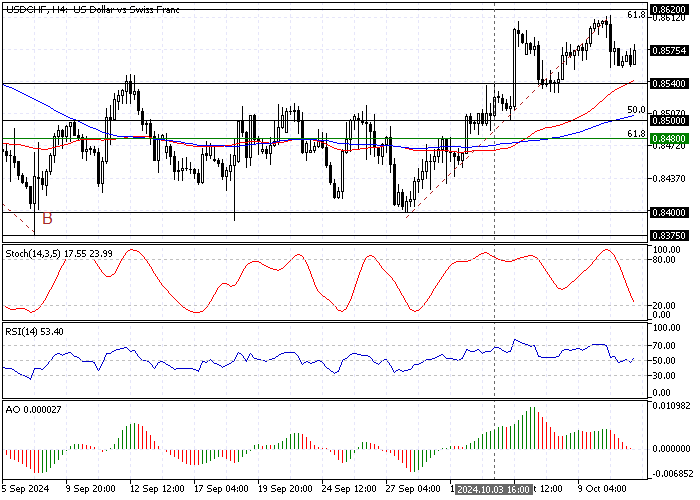
FxNews.me—The USD/CHF currency pair consolidates above the 50-period SMA and the $0.854 resistance as expected since the Stochastic was signaling overbought conditions. Interestingly, the Awesome Oscillator histogram not only turned red but also flipped below the signal line, signaling divergence that could result in a trend reversal.
Forecast
The immediate resistance rests at $0.854. The Swiss Franc could erase some of its losses against the Greenback if bears push the price below the immediate resistance and the 50-period simple moving average. If this scenario unfolds, the next target will likely be the 100-SMA, which is near the 50% Fibonacci retracement level and the $0.85 mark.
Conversely, the bearish outlook should be invalidated if the USD/CHF price exceeds $0.867. If this scenario unfolds, the path for the bulls to the next demand zone at $0.867 could be established.Though trading on financial markets involves high risk, it can still generate extra income in case you apply the right approach. By choosing a reliable broker such as InstaForex you get access to the international financial markets and open your way towards financial independence. You can sign up here.
-
Senior Member
- Join Date
- Sep 2024
- Posts
- 567
- Thanks
- 0
- Thanked 2,371 Times in 388 Posts
Bitcoin Dips but Holds $59,800 Support, Recovery Expected
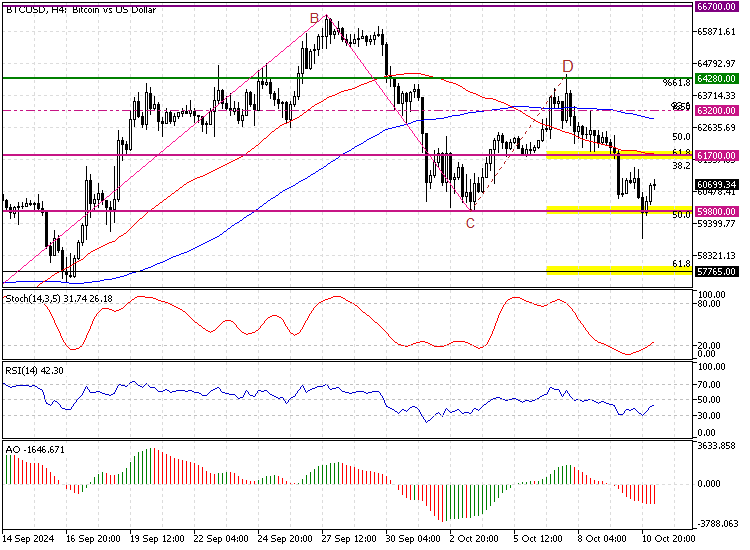
FxNews.me—Bitcoin pulled back after the bears failed to hold below the $59,800 active key support. Last day's dip in the BTC/USD price resulted in the Awesome Oscillator signaling divergence, meaning the digital gold has the potential to erase some of its recent losses.
That said, the primary resistance is at $61,700, near the 50-period simple moving average. From a technical perspective, for the bull market to resume, buyers must close and stabilize the price above $61,700.
The Bearish Scenario
The downtrend from $64,280 will likely spread to the next support level at $57,765 if bears (sellers) push the price below the $59,800 key support area.Though trading on financial markets involves high risk, it can still generate extra income in case you apply the right approach. By choosing a reliable broker such as InstaForex you get access to the international financial markets and open your way towards financial independence. You can sign up here.
-
Senior Member
- Join Date
- Sep 2024
- Posts
- 567
- Thanks
- 0
- Thanked 2,371 Times in 388 Posts
Gold Bears Eye New Targets Below $2,625
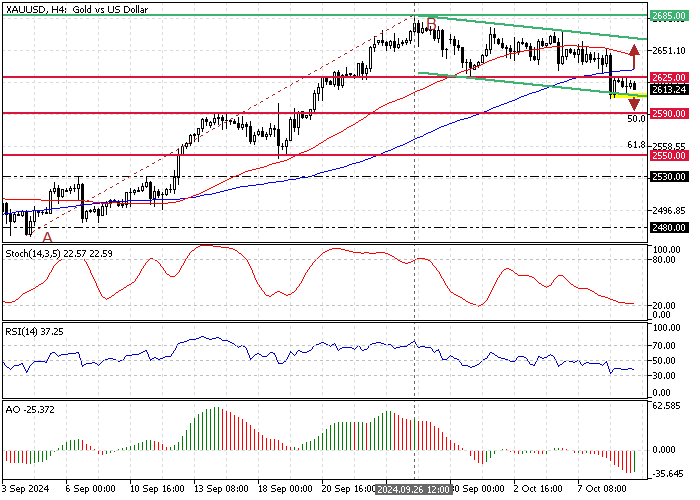
FxNews—Gold price fell below the $2,625 resistance as the Awesome Oscillator histogram turned red, signaling that the bearish trend may gain more momentum. As of this writing, XAU/USD bulls tested the $2,625 resistance, coinciding with the 100-period simple moving average, with the precious metal potentially initiating a new bearish wave.
Forecast
From a technical perspective, if the $2,625 level holds, the next bearish target could be $2,590. Furthermore, if the selling pressure exceeds $2,590, the decline could extend to the 61.8% Fibonacci retracement level of the AB bullish wave at $2,550.
Please note, the bear market should be considered invalid if the gold price rises above the 100-period SMA.Though trading on financial markets involves high risk, it can still generate extra income in case you apply the right approach. By choosing a reliable broker such as InstaForex you get access to the international financial markets and open your way towards financial independence. You can sign up here.
-
Senior Member
- Join Date
- Sep 2024
- Posts
- 567
- Thanks
- 0
- Thanked 2,371 Times in 388 Posts
USD/JPY Stuck in Tight Trading Range
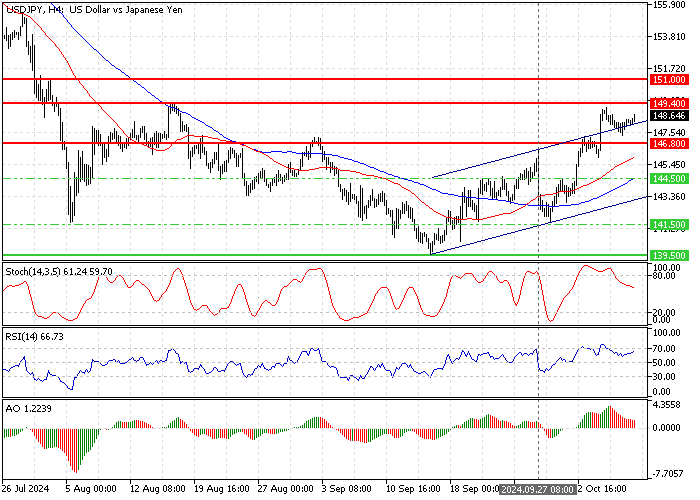
FxNews.me—The USD/JPY currency pair is consolidating in a narrow range, above the 146.8 support and below the 149.4 resistance. The primary trend is bullish because the U.S. dollar trades above the 50- and 100-period simple moving averages against the Japanese yen. However, the technical indicators show signs of bearish momentum.
The Stochastic Oscillator is declining, while the Awesome Oscillator bars have turned red and are approaching the signal line from above. On the other hand, the Relative Strength Index (RSI) gives a mixed signal, with its value above the median line and rising.
From a technical standpoint, 149.4 is a critical resistance level that has prevented the USD/JPY price from rising further. Therefore, the bulls must close and stabilize the price above 149.4 for the uptrend to resume. If this scenario unfolds, the next bullish target could be the 151.0 resistance area, backed by the daily 100-SMA.
Conversely, a dip below the immediate support at 146.8 could trigger a new bearish wave. In this scenario, the recent bearish momentum could extend to the 144.5 supply zone, followed by 141.5.Though trading on financial markets involves high risk, it can still generate extra income in case you apply the right approach. By choosing a reliable broker such as InstaForex you get access to the international financial markets and open your way towards financial independence. You can sign up here.
-
Senior Member
- Join Date
- Sep 2024
- Posts
- 567
- Thanks
- 0
- Thanked 2,371 Times in 388 Posts
WTI Crude Oil Price Analysis - 8-October-2024
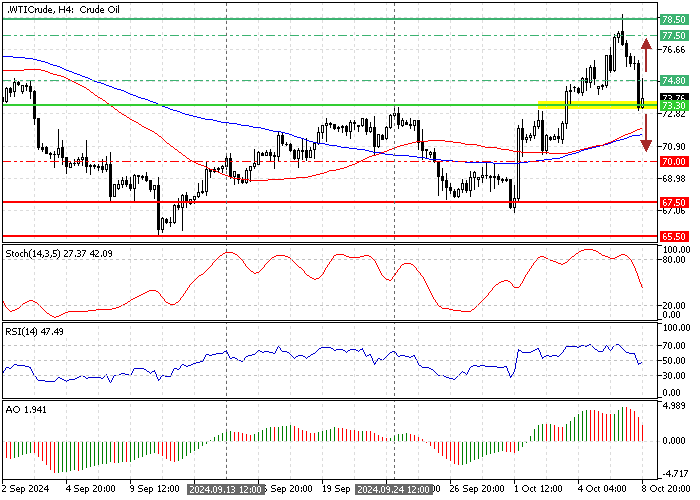
FxNews.me—WTI crude oil prices fell from $78.4 due to an overbought market signaled by the Stochastic oscillator over 80. The price dipped to $73.3 before rebounding to around $74.4, currently facing resistance at the August 28 low.
Despite a bearish indication from the Awesome oscillator and a downtrend signal from the Relative Strength Index falling below the median line, the overall trend remains bullish. This is supported by prices staying above the 50- and 100-period simple moving averages (SMA).
- Bullish Scenario: If the $73.3 resistance holds, an upward move could push prices over $74.8, targeting the $77.5 and possibly retesting the $78.5 highs.
- Bearish Scenario: A break below $73.3 could extend losses to the 100-period SMA near $71.4, and further selling might push prices down to the September 13 low of $70.
Support: $73.3, $71.4, $70.0, $67.5
Resistance: $74.8, $77.5, $78.5, $80.0Though trading on financial markets involves high risk, it can still generate extra income in case you apply the right approach. By choosing a reliable broker such as InstaForex you get access to the international financial markets and open your way towards financial independence. You can sign up here.
-
Senior Member
- Join Date
- Sep 2024
- Posts
- 567
- Thanks
- 0
- Thanked 2,371 Times in 388 Posts
Silver Slides Below SMA: Bearish Trend Takes Hold
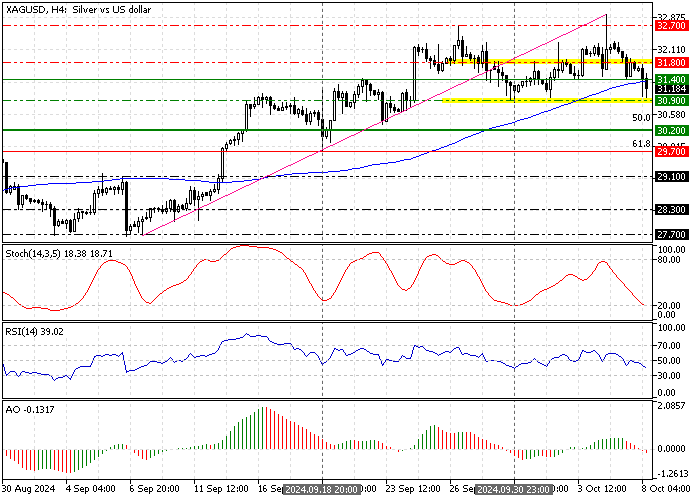
FxNews.me—Silver prices have fallen below the 100-period simple moving average, indicating a shift from a bullish to a bearish trend. Currently, silver is testing the support at $30.9, with technical indicators suggesting further declines.
Key Technical Indicators
The Stochastic oscillator is at 18, suggesting that silver is oversold and might briefly recover before resuming its downtrend. The Awesome oscillator has also moved below the signal line, reinforcing the bearish outlook.
Near-Term Forecast
If silver breaks below the $30.9 support, it could target the September 18 low of $30.2, and potentially reach the 61.8% Fibonacci retracement level at $29.7.
Bullish Scenario
A reversal above $31.4 or the 100-period SMA would invalidate the bearish trend, potentially pushing prices back to the September 2024 high of $32.7.
Support: $30.9, $30.2, $29.7
Resistance: $31.4, $31.8, $32.7Though trading on financial markets involves high risk, it can still generate extra income in case you apply the right approach. By choosing a reliable broker such as InstaForex you get access to the international financial markets and open your way towards financial independence. You can sign up here.
-
Senior Member
- Join Date
- Sep 2024
- Posts
- 567
- Thanks
- 0
- Thanked 2,371 Times in 388 Posts
USD/JPY Face Key Resistance as Bearish Indicators Strengthen
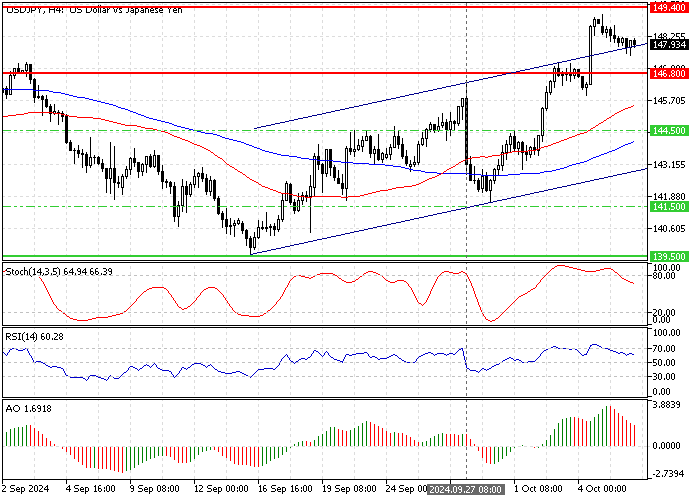
FxNews—The USD/JPY has been trading bullish from 139.5 but eased when the pair peaked at the 149.4 resistance. As of this writing, the pair is trading around 148.0, testing the broken trendline as support. The Awesome Oscillator histogram has turned red and is decreasing toward the signal line from above. Additionally, the Stochastic Oscillator and RSI (14) are dipping from overbought territory. This development in the technical indicators suggests that the bear market is strengthening.
Forecast
From a technical perspective, a new bearish wave will likely be initiated if the price falls below the immediate support at 146.8. In this scenario, the bearish momentum that began at 149.4 will likely extend to the next support level, backed by the 100-period simple moving average at 144.5.
Conversely, if the bulls close and stabilize the price above the 149.4 resistance, the uptrend will be triggered again, and the bulls' path to the 151.0 resistance area will likely be paved.Though trading on financial markets involves high risk, it can still generate extra income in case you apply the right approach. By choosing a reliable broker such as InstaForex you get access to the international financial markets and open your way towards financial independence. You can sign up here.
-
Senior Member
- Join Date
- Sep 2024
- Posts
- 567
- Thanks
- 0
- Thanked 2,371 Times in 388 Posts
GBP/USD Shows Potential for Recovery as Bullish Momentum Builds
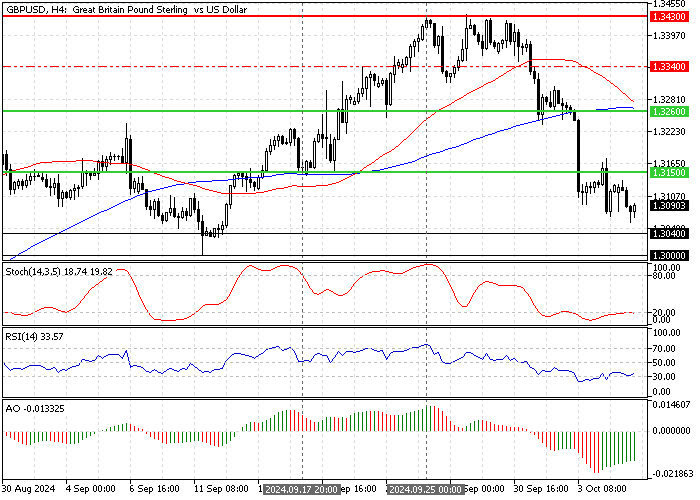
FxNews—The GBP/USD pair is trading in a bear market. Meanwhile, the Stochastic Oscillator hovers below the 20 line, signaling that the market is oversold. However, the Awesome Oscillator shows signs of bullish momentum, with green bars approaching the signal line from below.
Forecast
The critical support level is at 1.304. If this level holds, the British pound could potentially erase some of its losses against the U.S. dollar. In this scenario, the GBP/USD price could rise and test the 1.326 resistance, supported by the 100-period simple moving average.
Conversely, if the GBP/USD price falls below the immediate support, a new downtrend will likely be triggered. In this scenario, the bearish wave from 1.343 will likely extend to the next support area at 1.30.Though trading on financial markets involves high risk, it can still generate extra income in case you apply the right approach. By choosing a reliable broker such as InstaForex you get access to the international financial markets and open your way towards financial independence. You can sign up here.
-
Senior Member
- Join Date
- Sep 2024
- Posts
- 567
- Thanks
- 0
- Thanked 2,371 Times in 388 Posts
Oversold EUR/USD Pair Testing Major $1.095 Support Zone
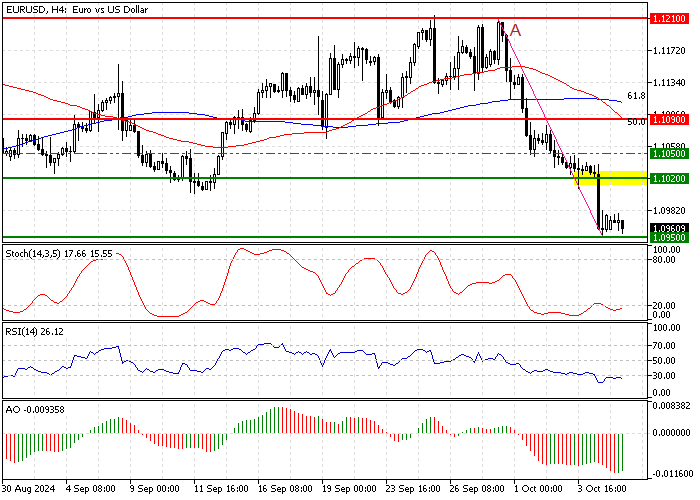
FxNews—The EUR/USD pair is trading bearish, testing the $1.095 critical support in today's trading session. Meanwhile, the Stochastic and RSI (14) indicators hover in the oversold territory, signaling a market saturated with selling pressure.
From a technical perspective, it is not advisable to join the bear market when it is oversold. Hence, retail traders and investors should wait patiently for the EUR/USD price to consolidate near the upper resistance level. In this scenario, the $1.102 demand zone could provide a decent entry point. Traders should monitor this level for bearish signals, such as a long-wick candlestick pattern or a bearish engulfing pattern.
That said, the next bearish target will likely be $1.088 if the price dips below $1.095. Please note, the bear market should be invalidated if the EUR/USD price crosses above $1.109, supported by the 50% Fibonacci retracement level of the AB wave.Though trading on financial markets involves high risk, it can still generate extra income in case you apply the right approach. By choosing a reliable broker such as InstaForex you get access to the international financial markets and open your way towards financial independence. You can sign up here.
Results 191 to 200 of 228

 Reply With Quote