 Thread:


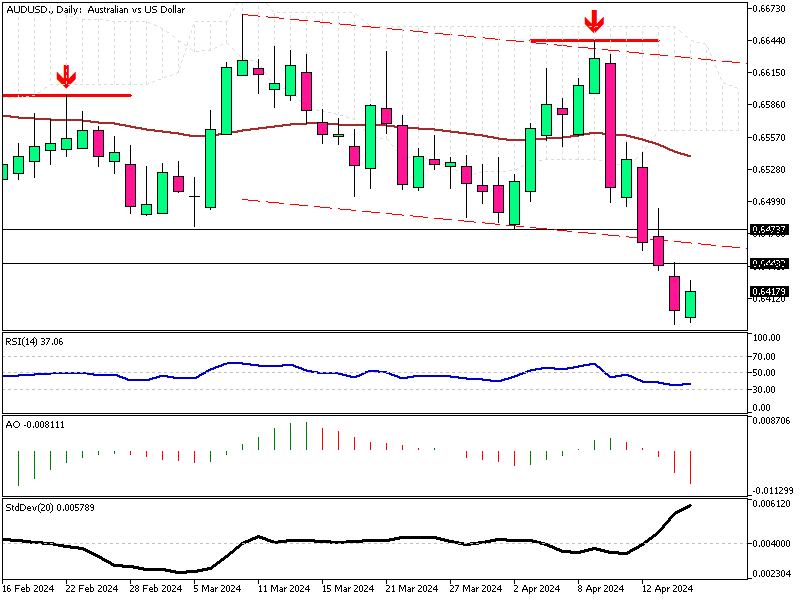
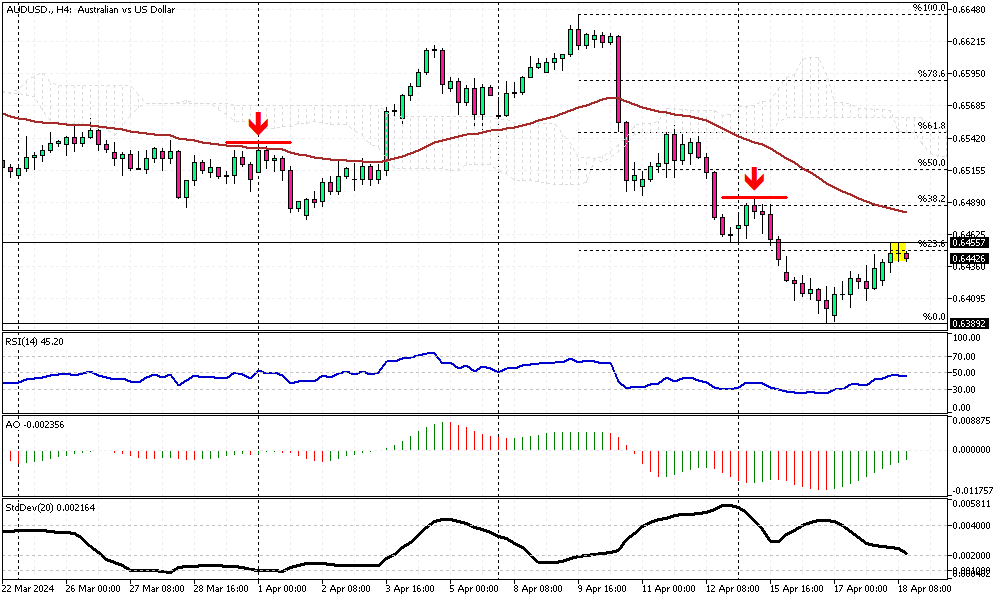
Australian Dollar's Struggle Below EMA 50 Explained
Solid ECN – The Australian dollar trades at about 0.644 against the U.S. dollar as of writing, slightly below the broken support level of 0.6455. Interestingly, the AUDUSD 4-hour chart shows a doji candlestick pattern, highlighted in the image above.
The Relative Strength Index still hovers below 50, but the Awesome Oscillator bars are green, giving mixed signals. Despite the contradiction between the technical indicators, the primary trend is bearish, and the pair trades below EMA 50. Based on price action analysis, our first bearish signal is the doji candlestick pattern.
Therefore, from a technical standpoint, selling pressure will likely increase if the AUDUSD remains below EMA 50. Should the market shift downwards, its initial target would be this week's low of 0.6389.
Conversely, EMA 50 is the dividing line between bull and bear markets. The bear market could be considered over if the price crosses and stabilizes above EMA 50. In this scenario, the uptick momentum that began this week at 0.6389 could extend to 0.652.
Malaysia Forex Forum
- Forum
- Forex Charts
- Monitoring
- Forex TV

-
Senior Member


- Join Date
- Oct 2022
- Posts
- 1,145
- Thanks
- 1
- Thanked 1,377 Times in 448 Posts
Though trading on financial markets involves high risk, it can still generate extra income in case you apply the right approach. By choosing a reliable broker such as InstaForex you get access to the international financial markets and open your way towards financial independence. You can sign up here.
-
Senior Member
- Join Date
- Oct 2022
- Posts
- 1,145
- Thanks
- 1
- Thanked 1,377 Times in 448 Posts
GBPUSD Sideways Movement: Bearish Signals Despite Consolidation
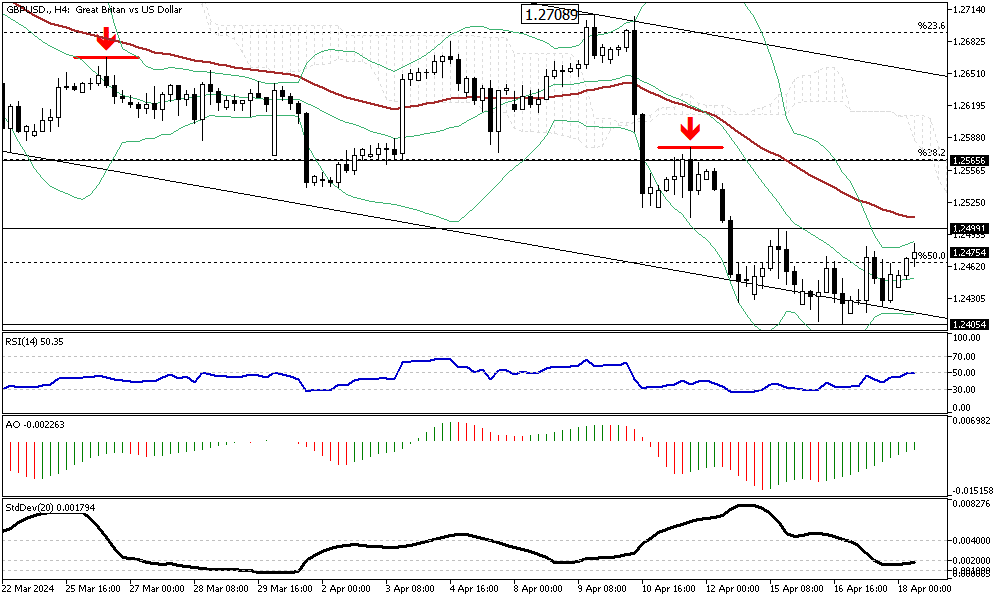
Solid ECN—The GBPUSD currency pair trades sideways between 1.249 and 1.240. The Bollinger Bands are squeezed and clearly demonstrate the range area on the 4-hour chart. Other technical indicators, except Standard Deviation, signal and promise a bullish trend while the uptick momentum is weak, and we don't see strength from the buyers.
From a technical standpoint, the primary trend is bearish while the pair hovers below EMA 50 and the Ichimoku cloud. However, the current consolidation phase might test the EMA 50 again in today's trading session, potentially forming a double-top pattern on the 4-hour chart.
Consequently, a failure to stabilize the price above 1.2499 will likely lead to a decline, and initially, the pair would test this week's low at 1.240 support.Though trading on financial markets involves high risk, it can still generate extra income in case you apply the right approach. By choosing a reliable broker such as InstaForex you get access to the international financial markets and open your way towards financial independence. You can sign up here.
-
Senior Member
- Join Date
- Oct 2022
- Posts
- 1,145
- Thanks
- 1
- Thanked 1,377 Times in 448 Posts
Tracking the Dip: U.S. Oil's Technical Outlook
Solid ECN – Oil is trading within a bullish flag pattern, indicating potential for future gains. However, it's crucial to note that it remains above the 50-day Exponential Moving Average (EMA 50), a key indicator that suggests bullish momentum is intact. Nevertheless, the plot has a twist as the technical indicators hint at a bearish trend.
The Relative Strength Index (RSI) has dipped below 50, and the Awesome Oscillator shows red bars declining toward the signal line. This combination of signals might indicate a potential shift towards bearish territory, especially if prices continue to fall towards the 50% Fibonacci level, which coincides with the EMA 50.
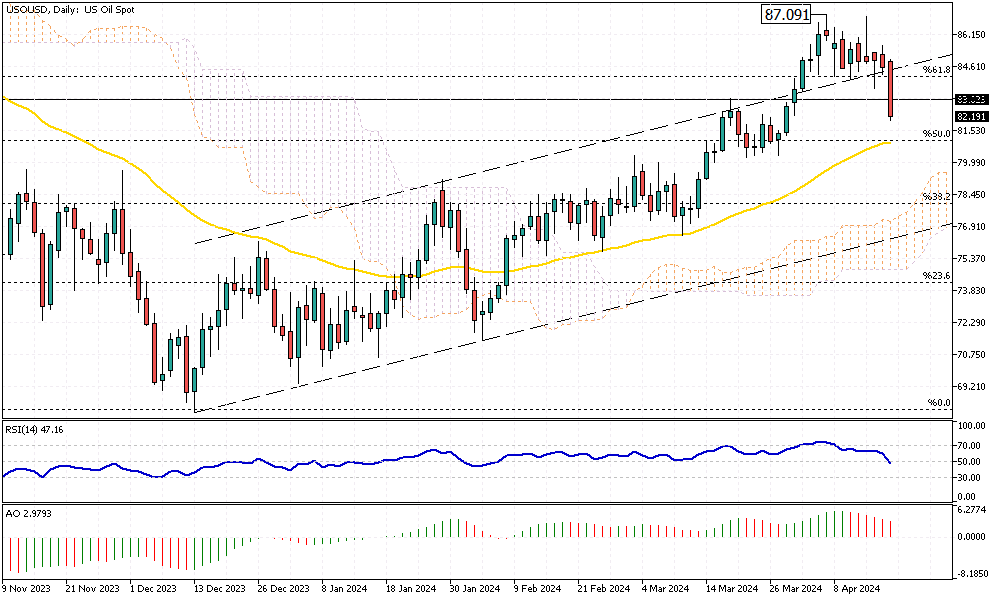
Short-Term Forecast and Trading Suggestions
The market appears to be entering a consolidation phase, with a possible decline to the lower boundary of the bullish flag at $76.0. For the bearish trend to gain momentum, prices must breach significant support levels, including the EMA 50 and the psychological $80.0 mark. Traders should closely monitor these levels as they could dictate the market's short-term direction.
Today, we expect the downward trend to extend to the $80.0 support level. Further declines could push the price to approximately $77.0 per barrel if this level fails. Keeping up-to-date on these developments is crucial for traders and market analysts alike.Though trading on financial markets involves high risk, it can still generate extra income in case you apply the right approach. By choosing a reliable broker such as InstaForex you get access to the international financial markets and open your way towards financial independence. You can sign up here.
-
Senior Member
- Join Date
- Oct 2022
- Posts
- 1,145
- Thanks
- 1
- Thanked 1,377 Times in 448 Posts
Critical Resistance Tests for USD/MXN's Bullish Trend

Solid ECN – The U.S. Dollar broke out from the bearish channel against the Mexican Peso in yesterday's trading session. The USD/MXN pair currently trades at about 16.97 inside the Ichimoku cloud, which represents the resistance area.
The technical indicators are bullish; the relative strength index hovers above 50, and the awesome oscillator bars are green. Therefore, we can interpret that the bearish market is paused, and there might be a shift in trend from bearish to bullish.
However, for the uptick in momentum to continue, the bulls face the 38.2% Fibonacci barrier. Failure to overcome this resistance area will likely lead to the continuation of the downtrend.
If the pair stabilizes itself above the Ichimoku cloud and the Fibonacci level mentioned earlier, the bullish wave is likely to extend further, aiming for the 50% Fibonacci level.Though trading on financial markets involves high risk, it can still generate extra income in case you apply the right approach. By choosing a reliable broker such as InstaForex you get access to the international financial markets and open your way towards financial independence. You can sign up here.
-
Senior Member
- Join Date
- Oct 2022
- Posts
- 1,145
- Thanks
- 1
- Thanked 1,377 Times in 448 Posts
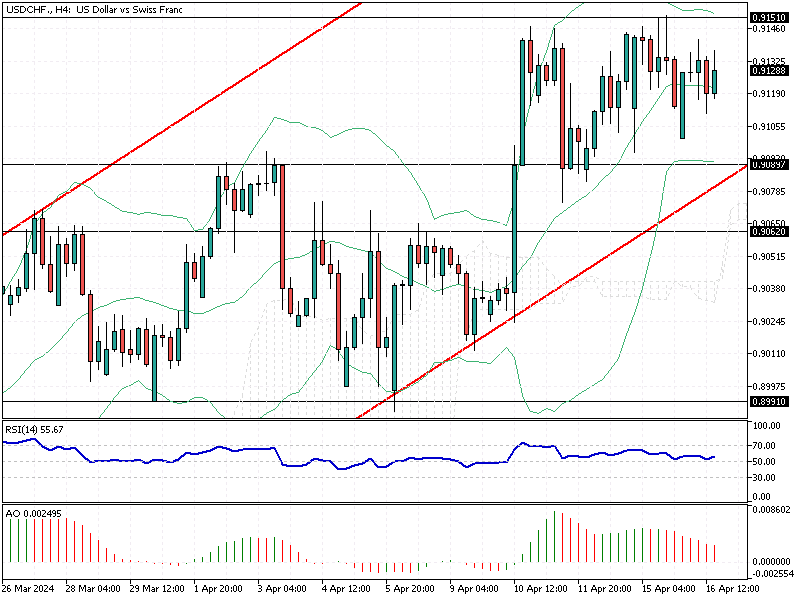
USDCHF Dips but Bullish Trend Holds
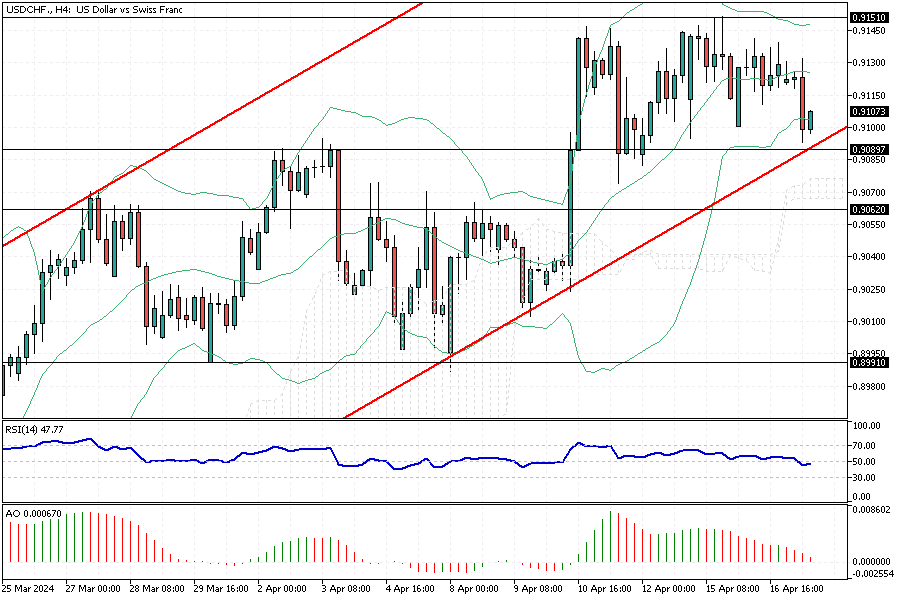
Solid ECN – The USDCHF currency pair experienced a slight decline, reaching approximately 0.910. This movement brings it close to the lower boundary of the bullish flag—a pattern suggesting a potential rise in value. This specific price point is bolstered by additional support at 0.908 and further underpinned by the Ichimoku cloud.
Despite the dip, no significant candlestick patterns used to forecast price direction changes were observed on the USDCHF 4-hour chart. This absence typically indicates that the current upward trend may continue, provided the price remains above the Ichimoku cloud. Should this scenario hold, the U.S. Dollar will likely climb toward the 0.915 mark, aiming next for the upper boundary of the bullish flag.
However, there is a flip side to consider. If the price falls below 0.9062, it would signal an end to the bullish trend, transitioning into a bear market. Such a drop could increase selling pressure, potentially pushing the price to around 0.899.Though trading on financial markets involves high risk, it can still generate extra income in case you apply the right approach. By choosing a reliable broker such as InstaForex you get access to the international financial markets and open your way towards financial independence. You can sign up here.
-
Senior Member
- Join Date
- Oct 2022
- Posts
- 1,145
- Thanks
- 1
- Thanked 1,377 Times in 448 Posts
Bearish Outlook: AUDUSD Tests Critical Supports
Solid ECN – The Australian dollar started today's trading session with an uptick in momentum against the U.S. Dollar and is trading at about 0.641. The AUDUSD 4-hour chart above shows that the pair is rising to test the previously broken supports at the 0.6443 and 0.6473 marks.
Considering the primary trend, which is bearish, the above-mentioned price points offer a decent opportunity to join the bear market. Therefore, we suggest monitoring these levels closely and looking for bearish candlestick patterns on a smaller time frame, such as the 4-hour chart.Though trading on financial markets involves high risk, it can still generate extra income in case you apply the right approach. By choosing a reliable broker such as InstaForex you get access to the international financial markets and open your way towards financial independence. You can sign up here.
-
Senior Member
- Join Date
- Oct 2022
- Posts
- 1,145
- Thanks
- 1
- Thanked 1,377 Times in 448 Posts
Bitcoin Price Fails at Key Resistance Levels
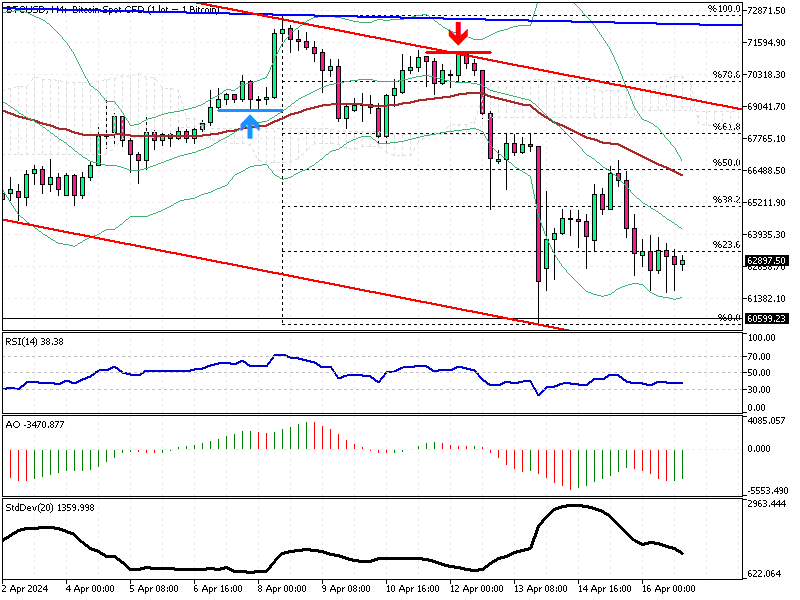
Solid ECN – Bitcoin price failed to surpass the EMA 50 and the 50% Fibonacci resistance level in the previous trading session. Consequently, the digital gold dipped below the 23.6% Fibonacci support level and traded at about $62,800 when writing.
The technical indicators give mixed signals. The RSI hovers below 50, and the awesome oscillator bars are green and approaching the signal line. This can be interpreted as uncertainty in the market.
As shown in the BTCUSD 4-hour chart above, the pair trades with a wide bearish flag in red, which widens the trading range and increases the risk. This is the downside of trading cryptocurrencies.
Therefore, we suggest waiting for the Bitcoin price to reach critical support levels before entering the market. Since the trend is bearish in the short term, the market dip might extend to the lower band of the flag or to April's low, the $60,500 area.Though trading on financial markets involves high risk, it can still generate extra income in case you apply the right approach. By choosing a reliable broker such as InstaForex you get access to the international financial markets and open your way towards financial independence. You can sign up here.
-
Senior Member
- Join Date
- Oct 2022
- Posts
- 1,145
- Thanks
- 1
- Thanked 1,377 Times in 448 Posts
USDCHF Analysis: Bollinger Bands & Bull Markets
Solid ECN – The USDCHF trades sideways in a narrow range between 0.915 and 0.908. The 4-hour chart above shows that the Bollinger bands are also squeezed. The squeezed Bollinger bands can be interpreted as the market resting and waiting for economic updates from the central banks. It is worth noting that the Awesome Oscillator divergence signaled this correction or consolidation phase.
From a technical perspective, the USDCHF is in a bull market, trading inside a rising flag. The uptrend will likely continue if the price steps above the 0.915 resistance.
Conversely, the Ichimoku cloud, or the lower band of the flag, stands between the bull and bear markets. Should the price dip and stabilize itself below 0.906, the bull market would be invalidated, and the decline would aim for the 0.8991 mark.Though trading on financial markets involves high risk, it can still generate extra income in case you apply the right approach. By choosing a reliable broker such as InstaForex you get access to the international financial markets and open your way towards financial independence. You can sign up here.
-
Senior Member
- Join Date
- Oct 2022
- Posts
- 1,145
- Thanks
- 1
- Thanked 1,377 Times in 448 Posts
ETHUSD: Bearish Trends Below Ichimoku Cloud
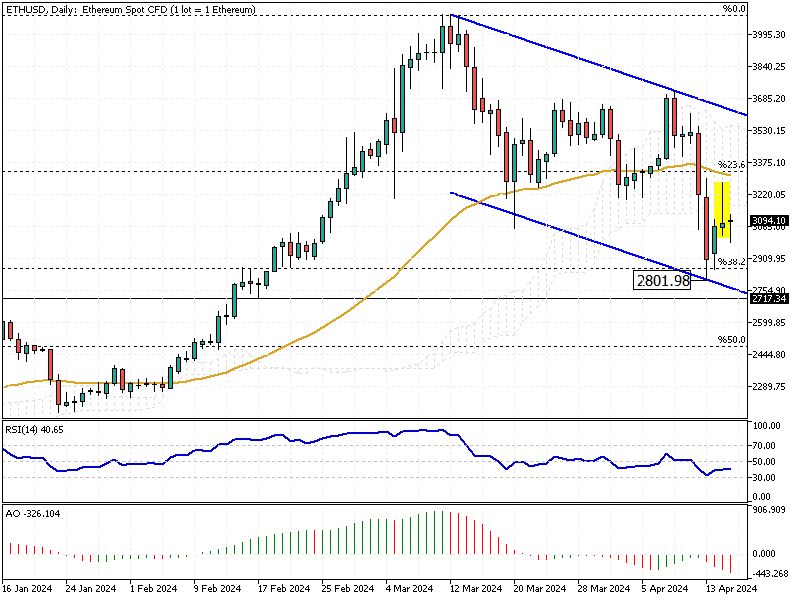
Solid ECN – The ETHUSD price stabilizes below the Ichimoku cloud after pulling back from the 38.2% Fibonacci support level at $2,801. The technical indicators are bearish, with the Relative Strength Index hovering below 50 and the Awesome Oscillator below the signal line, its bars in red.
The ETHUSD chart above shows that the pair trades within a bearish flag. Therefore, from a technical standpoint, the trend remains bearish, and the decline will likely extend to the lower band of the flag, followed by the $2,717 support level.
Conversely, the bull market would be invalidated if the price crosses and stabilizes above the flag.Though trading on financial markets involves high risk, it can still generate extra income in case you apply the right approach. By choosing a reliable broker such as InstaForex you get access to the international financial markets and open your way towards financial independence. You can sign up here.
-
Senior Member
- Join Date
- Oct 2022
- Posts
- 1,145
- Thanks
- 1
- Thanked 1,377 Times in 448 Posts
Bullish Gold: Navigating the Upswing with Fibonacci and Technical Indicators
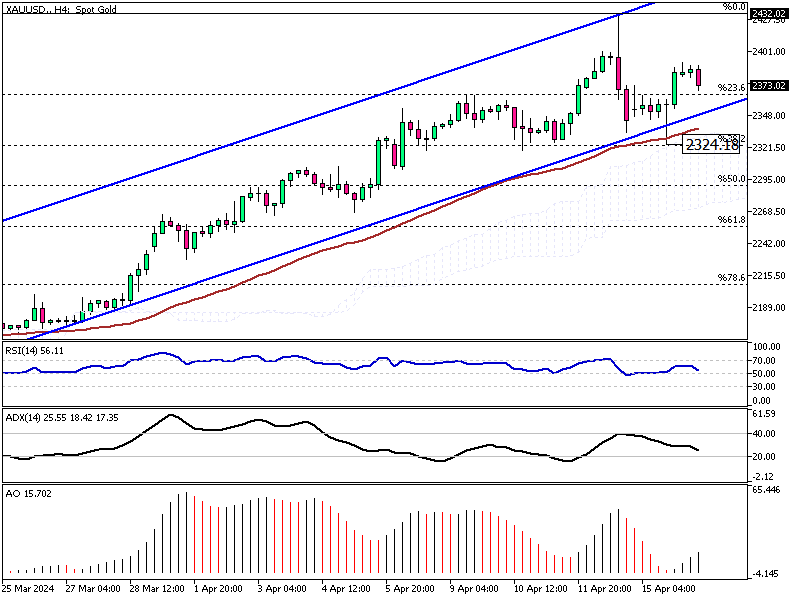
Solid ECN – The gold price returned upward after it touched the 38.2% Fibonacci level, which coincides with the EMA 50 and the Ichimoku cloud at the $2,324 mark. Interestingly, the XAU/USD 4-hour chart formed a bullish long-wick candlestick pattern, which signals the continuation of the bull market.
As of this writing, the yellow metal is trading at about $2,370, slightly above the 23.6% Fibonacci support. The technical indicators are also bullish. The RSI indicator hovers above the 50 level and the Awesome Oscillator bars are green and above the signal line.
From a technical perspective, as long as the price remains above the EMA 50 and inside the flag, the market trend remains bullish. The next target will likely be April’s high at the $2,432 mark.
Conversely, the bull market is invalidated if the XAU/USD price dips below the 38.2% Fibonacci support.Though trading on financial markets involves high risk, it can still generate extra income in case you apply the right approach. By choosing a reliable broker such as InstaForex you get access to the international financial markets and open your way towards financial independence. You can sign up here.
Results 1 to 10 of 1161

 Reply With Quote