 Thread:


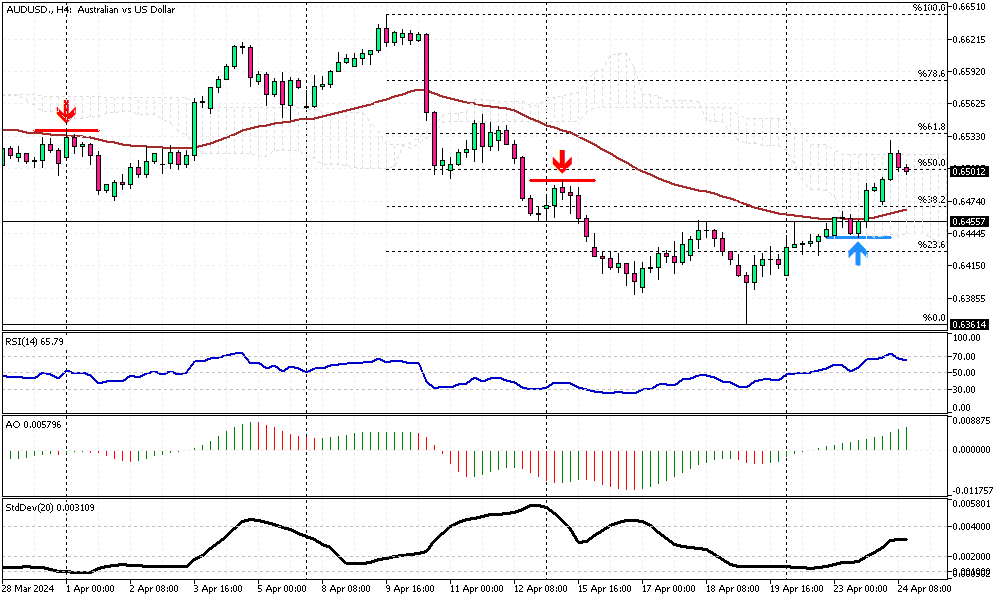
Australian Dollar Peaks as Inflation Surprises
Solid ECN – Recently, the Australian dollar climbed above $0.65, reaching its highest point in nearly two weeks. This increase came after unexpectedly strong inflation data within Australia, suggesting that the Reserve Bank of Australia might keep interest rates stable. In the first quarter, Australia's consumer price index dropped to 3.6% from 4.1% in the previous quarter. Although this marks the fifth consecutive quarterly decline, it was still higher than the predicted 3.4%.
Additionally, Australia's monthly CPI rate rose to 3.5% in March, up from 3.4% in February, which was surprising as analysts expected it to remain unchanged. Earlier in the week, new data revealed that Australia's private sector growth hit a two-year high in April, driven by near-stable manufacturing and continued service growth.
Meanwhile, the Australian dollar also gained from a weakening US dollar, which fell as business activity in the US slowed in April, pointing towards a less aggressive monetary policy by the Federal Reserve.
Malaysia Forex Forum
- Forum
- Forex Charts
- Monitoring
- Forex TV

-
Senior Member


- Join Date
- Oct 2022
- Posts
- 1,159
- Thanks
- 1
- Thanked 1,377 Times in 448 Posts
Though trading on financial markets involves high risk, it can still generate extra income in case you apply the right approach. By choosing a reliable broker such as InstaForex you get access to the international financial markets and open your way towards financial independence. You can sign up here.
-
Senior Member
- Join Date
- Oct 2022
- Posts
- 1,159
- Thanks
- 1
- Thanked 1,377 Times in 448 Posts
UK Pound Near Low as Investors Eye Rate Cut Soon
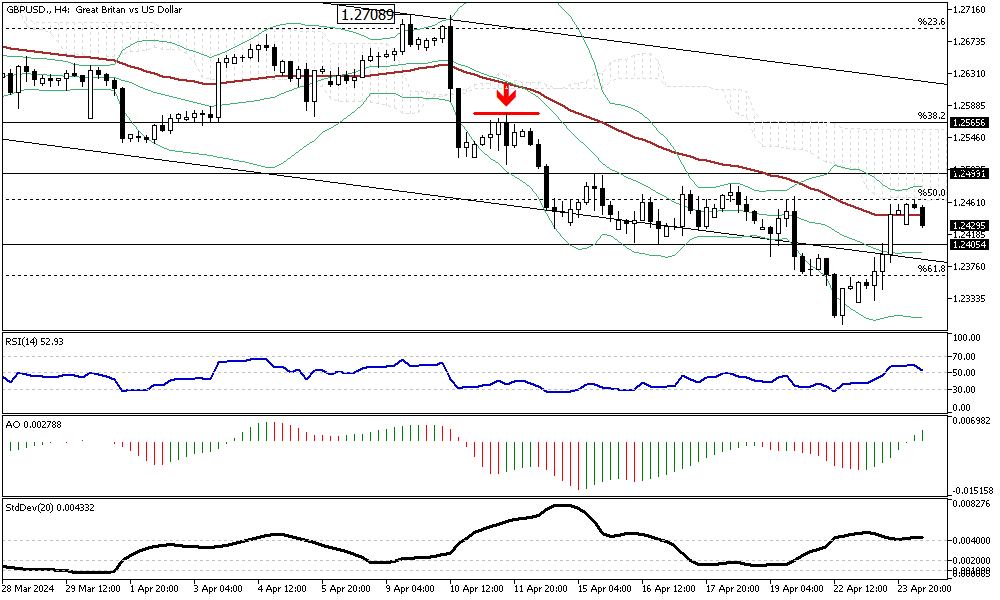
Solid ECN – The British pound has traded just above $1.24, hovering near its lowest level since mid-November. This comes as investors process robust UK PMI data and consider how it might influence future economic policies.
The most recent data shows a significant boost in British business activity in April, the highest since May 2023, primarily due to a surge in services output. Regarding monetary policy, expectations have shifted, predicting an initial decrease in borrowing costs as early as August, sooner than the earlier forecast of September.
This shift followed comments from Deputy Governor Dave Ramsden, who noted a decreased risk of persistently high British inflation and the possibility that it could drop below the Bank of England's latest projections.
Conversely, Chief Economist Huw Pill acknowledged that the new economic reports suggest an impending rate cut, though he cautioned that it might still be some distance away.Though trading on financial markets involves high risk, it can still generate extra income in case you apply the right approach. By choosing a reliable broker such as InstaForex you get access to the international financial markets and open your way towards financial independence. You can sign up here.
-
Senior Member
- Join Date
- Oct 2022
- Posts
- 1,159
- Thanks
- 1
- Thanked 1,377 Times in 448 Posts
Euro Gains Amid Strong Europe PMI Data
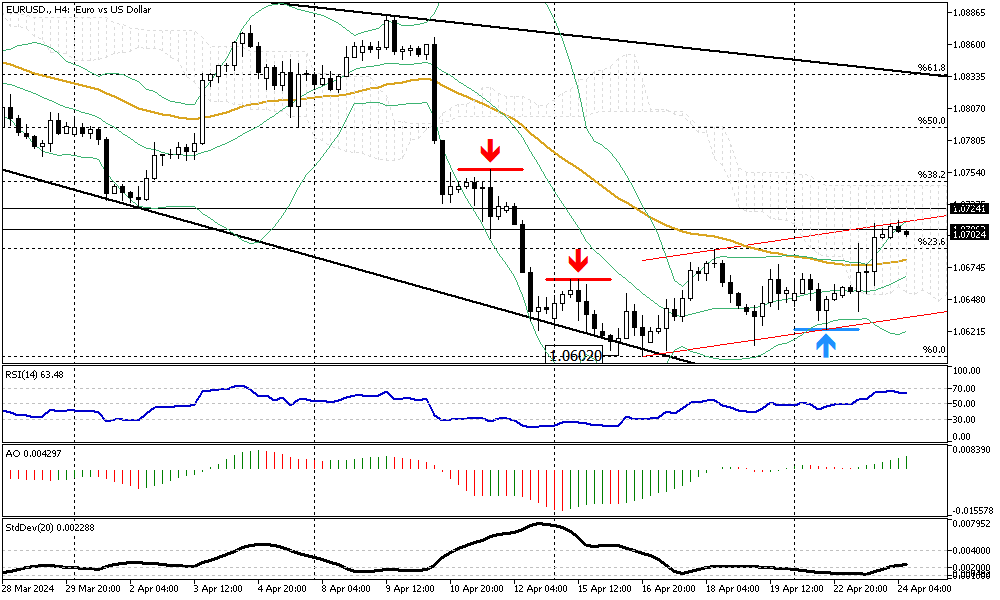
Solid ECN – The euro's value increased to over $1.065, though it stayed near its lowest point since the beginning of November. This movement came as investors evaluated surprisingly strong preliminary PMI data from some of Europe's biggest economies. Recent surveys showed that business activity in the Eurozone increased more in April than in almost a year.
Germany saw economic growth for the first time in nine months. Regarding monetary policy, European Central Bank (ECB) officials indicated a readiness to start lowering borrowing costs possibly by June, with some predicting up to three rate cuts by the end of 2024. However, the overall market mood has changed slightly.
Expectations for rate reductions by the ECB and the U.S. Federal Reserve have lessened this year, driven by ongoing high inflation and signs of a sturdy economy in the U.S.Though trading on financial markets involves high risk, it can still generate extra income in case you apply the right approach. By choosing a reliable broker such as InstaForex you get access to the international financial markets and open your way towards financial independence. You can sign up here.
-
Senior Member
- Join Date
- Oct 2022
- Posts
- 1,159
- Thanks
- 1
- Thanked 1,377 Times in 448 Posts
U.S. Oil Eyes $87 High as Bullish Trends Hold
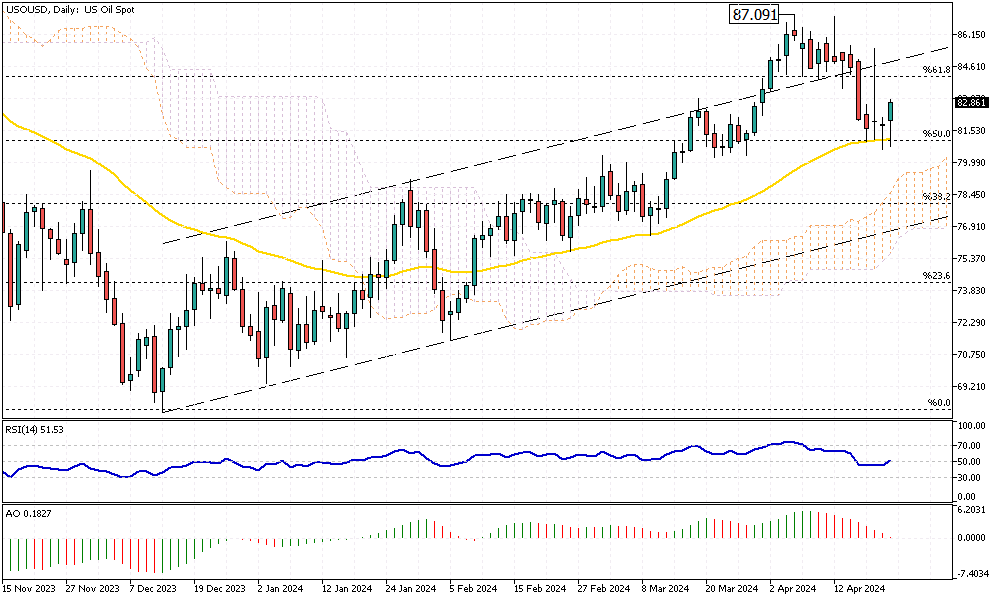
Solid ECN Blog – Yesterday, U.S. Crude oil prices formed a bullish long-wick candlestick pattern, as depicted in the daily chart above. This development occurred near the 50% Fibonacci retracement level, coinciding with the 50-day Exponential Moving Average (EMA 50).
The Relative Strength Index (RSI) is poised to rise above 50, signaling a potential uptrend continuation.
From a technical perspective, U.S. Oil remains in an uptrend, supported by the EMA 50. As long as this level holds, the outlook remains bullish, with the next target potentially being the March high of $87.0.
Conversely, should prices fall below the EMA 50, the bullish scenario would be invalidated, potentially leading to a decline toward the lower flag band at the $78 threshold.Though trading on financial markets involves high risk, it can still generate extra income in case you apply the right approach. By choosing a reliable broker such as InstaForex you get access to the international financial markets and open your way towards financial independence. You can sign up here.
-
Senior Member
- Join Date
- Oct 2022
- Posts
- 1,159
- Thanks
- 1
- Thanked 1,377 Times in 448 Posts
GBPJPY Tests Resistance: Potential Bullish Breakout

Solid ECN – The GBPJPY currency pair rebounded from the lower band of the bullish flag today and is now testing the 192.8 barrier.
The technical indicators are bullish, and the pair will likely break out. If this scenario plays out, it would allow GBP buyers to reach the upper band of the flag against the Japanese Yen.Though trading on financial markets involves high risk, it can still generate extra income in case you apply the right approach. By choosing a reliable broker such as InstaForex you get access to the international financial markets and open your way towards financial independence. You can sign up here.
-
Senior Member
- Join Date
- Oct 2022
- Posts
- 1,159
- Thanks
- 1
- Thanked 1,377 Times in 448 Posts
Bearish Signs for NZD/USD
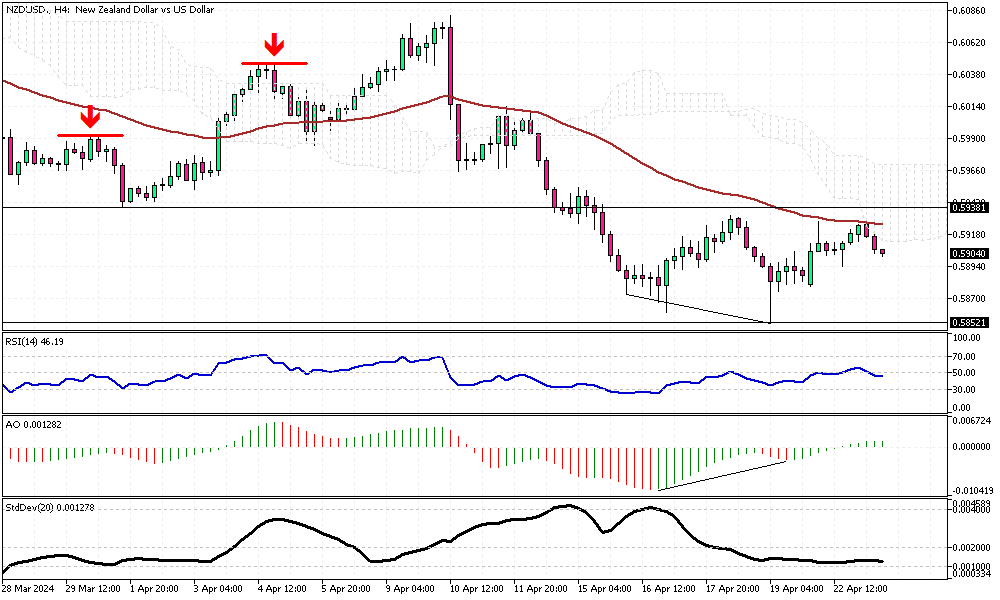
Solid ECN—The New Zealand dollar traded below the Ichimoku Cloud and the 50 EMA against the U.S. Dollar, sitting at around 0.59 during Tuesday's U.K. trading session.
The technical indicators give mixed signals, but they have a more bearish than bullish outlook. The Relative Strength Index hovers below the 50 level, but Awesome Oscillator bars are green and hovering above the signal level. It is worth noting that the AO indicator signals divergence in its bars, which can be interpreted as either a consolidation phase or a potential trend reversal on the horizon. Therefore, traders and investors should approach the NZD/USD market with caution.
From a technical standpoint, the primary trend is bearish as long as the pair stays below the 0.5938 resistance level, as depicted in the 4-hour chart above. In this scenario, the downtrend will likely resume, and the initial target would be to test April's low at the 0.5852 support level.
Conversely, the bearish outlook is invalidated if the NZD/USD price crosses and stabilizes above the 0.5938 mark.Though trading on financial markets involves high risk, it can still generate extra income in case you apply the right approach. By choosing a reliable broker such as InstaForex you get access to the international financial markets and open your way towards financial independence. You can sign up here.
-
Senior Member
- Join Date
- Oct 2022
- Posts
- 1,159
- Thanks
- 1
- Thanked 1,377 Times in 448 Posts
Bitcoin Faces Resistance: Can It Break the $67K Barrier?
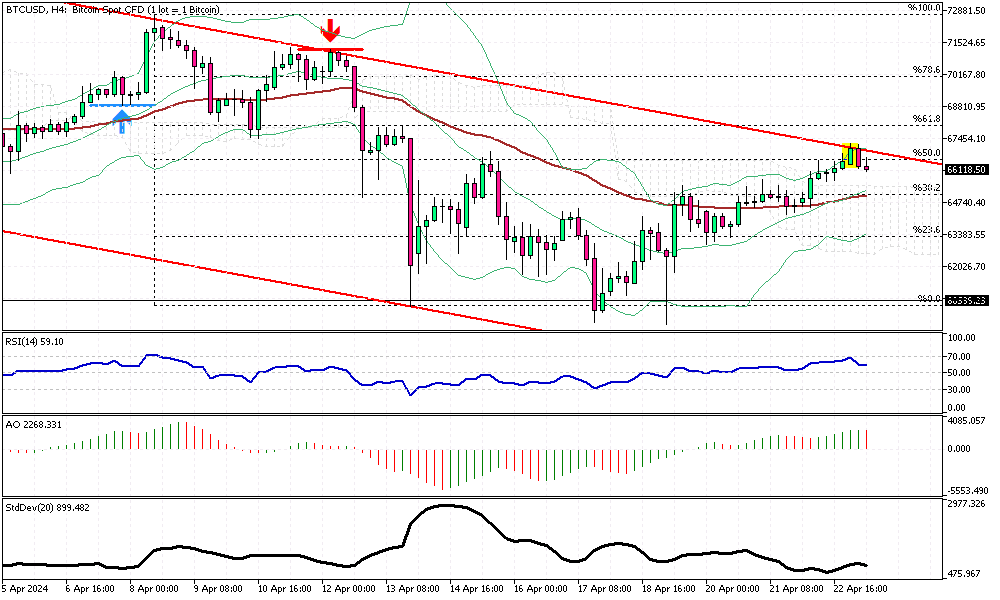
Solid ECN – Bitcoin, often called digital gold, has reached a critical resistance level around the $67,236 mark. The upper band of the wide bearish flag and the 50% Fibonacci support level support this barrier.
Technical indicators are signaling the bull market will continue. The BTCUSD price is above the Ichimoku cloud, and the relative strength index and the awesome oscillator hover above 50.
For the uptrend to continue, the price must close and stabilize itself above the 50% Fibonacci level, a task it has failed to achieve in today's trading session. Interestingly, the BTCUSD 4-hour chart has formed a bearish engulfing pattern, a signal that suggests a shift in trend from a bull to a bear market.
Therefore, if the price remains below the flag, a dip in the Bitcoin price is still possible.
We suggest monitoring the price behavior around the 50% Fibonacci level and the EMA 50 in today's trading session.Though trading on financial markets involves high risk, it can still generate extra income in case you apply the right approach. By choosing a reliable broker such as InstaForex you get access to the international financial markets and open your way towards financial independence. You can sign up here.
-
Senior Member
- Join Date
- Oct 2022
- Posts
- 1,159
- Thanks
- 1
- Thanked 1,377 Times in 448 Posts
Gold Prices Dip Below Key Technical Levels
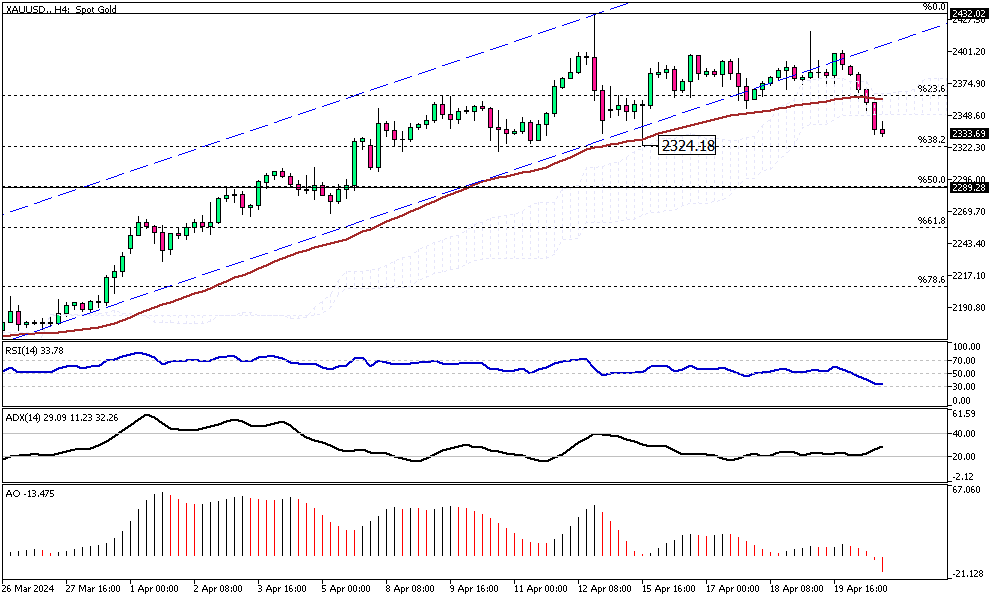
Solid ECN—In today's trading session, the yellow metal dipped below the 23.6% Fibonacci support level and the Ichimoku cloud. When writing, the XAUUSD price is floating around $2,336, stabilizing below the EMA 50.
The technical indicators are bearish, with the relative strength index hovering below 50, and the awesome oscillator bars are in red and below the signal line.
From a technical standpoint, the gold market might have entered a consolidation phase that could extend to the 50% Fibonacci level at the $2,289 mark.
Conversely, should the price of gold flip above the cloud, we can consider that the uptrend will likely continue.Though trading on financial markets involves high risk, it can still generate extra income in case you apply the right approach. By choosing a reliable broker such as InstaForex you get access to the international financial markets and open your way towards financial independence. You can sign up here.
-
Senior Member
- Join Date
- Oct 2022
- Posts
- 1,159
- Thanks
- 1
- Thanked 1,377 Times in 448 Posts
Watching Bitcoin's Key Fibonacci Levels for Trends
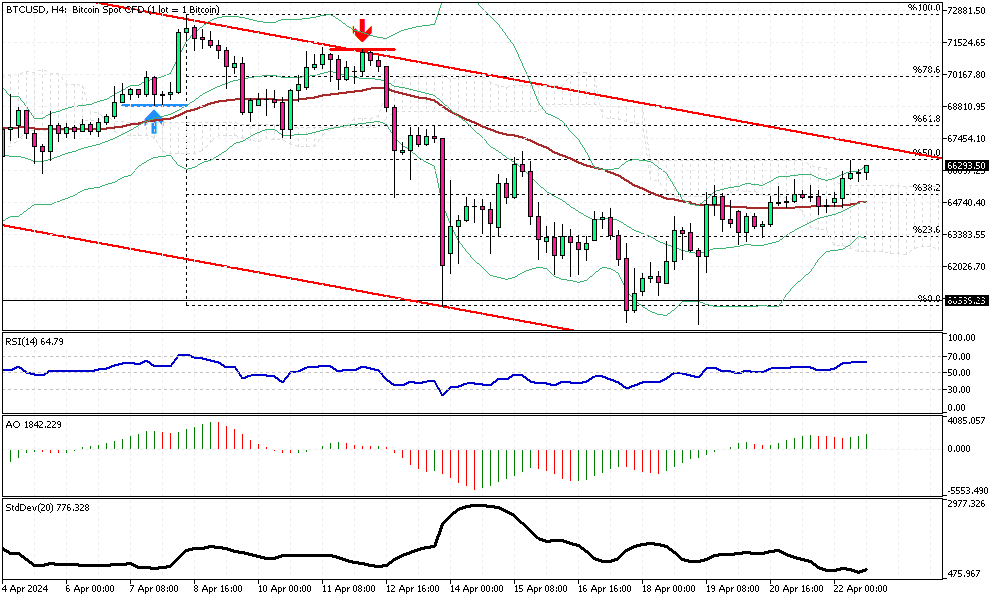
Solid ECN – Bitcoin has shifted above the EMA 50, and the digital gold has stabilized itself above the 38.2% Fibonacci level and the Ichimoku cloud. However, the BTCUSD price still needs to overcome the upper band of the bearish flag before further growth.
From a technical standpoint, with the Bitcoin price sustained below the 50% Fibonacci support level, the bearish outlook remains valid. In this scenario, the downward pressure should continue, and the initial target will likely be the 23.6% Fibonacci support level.
On the other hand, if the bulls break out from the flag, the uptrend should continue, paving the way to $72,000.
Traders should watch the price action and market behavior around the 50% Fibonacci level.Though trading on financial markets involves high risk, it can still generate extra income in case you apply the right approach. By choosing a reliable broker such as InstaForex you get access to the international financial markets and open your way towards financial independence. You can sign up here.
-
Senior Member
- Join Date
- Oct 2022
- Posts
- 1,159
- Thanks
- 1
- Thanked 1,377 Times in 448 Posts
Navigating USDCAD's Bearish Momentum & Reversals
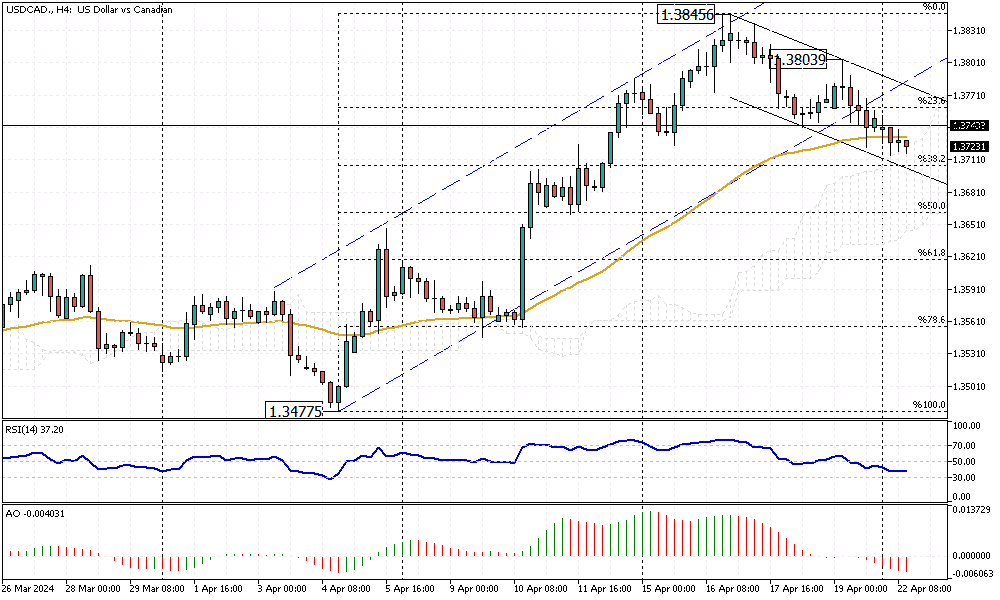
Solid ECN – The USDCAD price dipped below the bullish flag and the EMA 50. The pair is currently trading at about 1.372. This level coincides with the Ichimoku cloud resistance area, which is also close to the 38.2% Fibonacci level. While the RSI indicator hovers below the 50 level, it still has room to drop to 30 or become oversold. Therefore, it can be interpreted that the downward momentum will likely continue but might pause when it reaches the 38.2% Fibonacci level.
From a technical standpoint, going against the primary trend is risky. Traders should wait and monitor the price action around the 38.2% Fibonacci support level and the bearish flag in the 4-hour chart, depicted in black.
We suggest waiting patiently for the price to climb above the EMA 50 and the 23.6% Fibonacci level and join the bullish trend if there is a new breakout.Though trading on financial markets involves high risk, it can still generate extra income in case you apply the right approach. By choosing a reliable broker such as InstaForex you get access to the international financial markets and open your way towards financial independence. You can sign up here.
Results 1 to 10 of 1175

 Reply With Quote