 Thread:


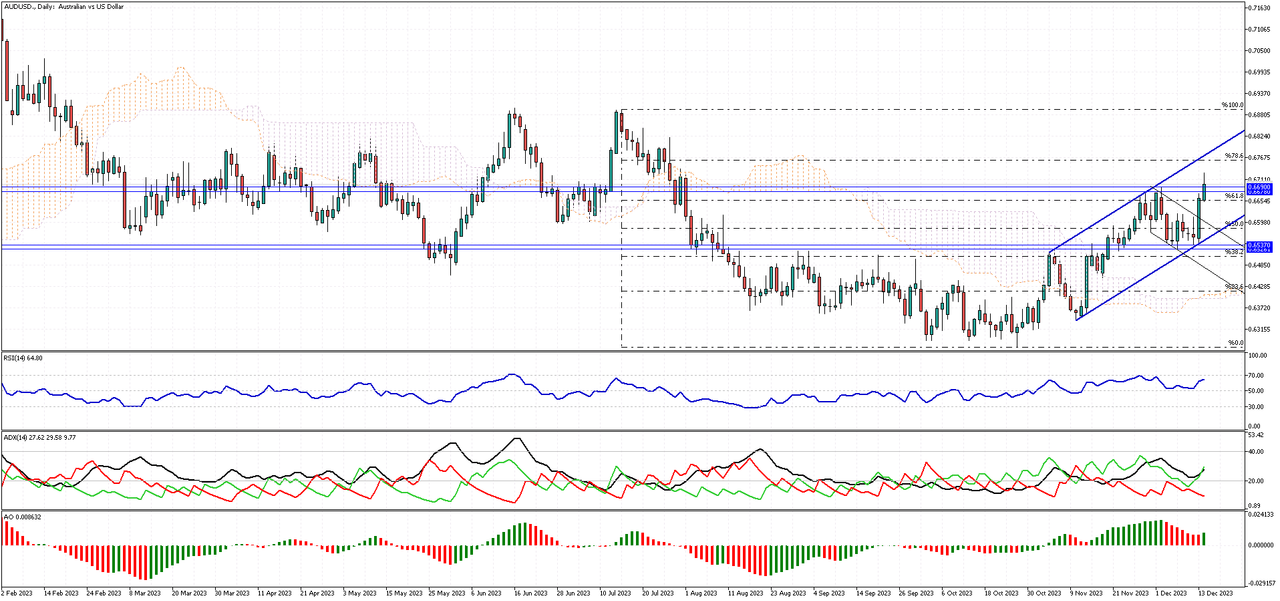
AUDUSD’s Bullish Journey: A Technical Analysis
Solid ECN – In our last analysis, we highlighted the potential for a positive shift in the AUDUSD pair. Following the Fed’s cautious stance on interest rates, the AUDUSD price has indeed risen above the Ichimoku cloud.
Currently, the AUDUSD price is grappling with a previously broken resistance. This resistance area is defined by the range of 0.6678 to 0.669. Interestingly, the RSI indicator is lingering in the overbought zone, suggesting a possible consolidation phase. As a result, the price may stabilize above 0.6678.
When we take a broader look at the daily chart, we can see the AUDUSD pair moving within a bullish channel. The bulls in the AUDUSD market appear to be aiming for the 78.6 Fibonacci resistance next. As long as the pair continues to trade within this channel, the primary trend remains optimistic.
Malaysia Forex Forum
- Forum
- Forex Charts
- Monitoring
- Forex TV

-
Senior Member


- Join Date
- Oct 2022
- Posts
- 1,248
- Thanks
- 1
- Thanked 1,818 Times in 593 Posts
Though trading on financial markets involves high risk, it can still generate extra income in case you apply the right approach. By choosing a reliable broker such as InstaForex you get access to the international financial markets and open your way towards financial independence. You can sign up here.
-
The Following User Says Thank You to Solid ECN For This Useful Post:
Unregistered (1)
-
Senior Member
- Join Date
- Oct 2022
- Posts
- 1,248
- Thanks
- 1
- Thanked 1,818 Times in 593 Posts
Historic Rise in European Stocks After Fed Maintains Rates
Solid ECN – European stocks experienced a significant boost on Thursday, reaching new heights after the US Federal Reserve's decision to maintain current interest rates. This announcement also came with an unexpected revelation: plans for three interest rate reductions in 2024, more than previously anticipated in September. This news sent the STOXX 50 index soaring by 1%, reaching a remarkable 23-year high of 4,585 points. Meanwhile, the wider STOXX 600 index also reached its highest level since January 2022.
The Federal Reserve's future plans, detailed in its "dot plot", suggest an even more aggressive rate reduction strategy. They foresee four cuts in 2025 and another three in 2026, aiming to lower the federal funds rate to between 2% and 2.25%. This approach is part of the Fed's strategy to avoid the risk of maintaining excessively high rates for an extended period, as emphasized by Fed Chairman Jerome Powell.
Investors are now keenly awaiting further monetary policy updates, particularly from the European Central Bank and the Bank of England, expected later on Thursday. These announcements are highly anticipated, as they could further influence global market trends.Though trading on financial markets involves high risk, it can still generate extra income in case you apply the right approach. By choosing a reliable broker such as InstaForex you get access to the international financial markets and open your way towards financial independence. You can sign up here.
-
The Following User Says Thank You to Solid ECN For This Useful Post:
Unregistered (1)
-
Senior Member
- Join Date
- Oct 2022
- Posts
- 1,248
- Thanks
- 1
- Thanked 1,818 Times in 593 Posts
EURUSD's Recent Surge: A Technical Analysis
Solid ECN – Recently, the EURUSD currency pair has shown a significant increase in activity, managing to close above the Ichimoku cloud. It formed an inverted hammer candlestick pattern, which occurred right at the 61.8% resistance level. At the same time, the RSI indicator signaled that the pair was overbought. If the price remains under the 61.8% support level, there's a chance it could fall to the 50% level, and maybe even down to 38.2%.

On the other hand, if the currency breaks past the 61.8% resistance level, this upward trend might push it towards the 78.6% resistance level.Though trading on financial markets involves high risk, it can still generate extra income in case you apply the right approach. By choosing a reliable broker such as InstaForex you get access to the international financial markets and open your way towards financial independence. You can sign up here.
-
The Following User Says Thank You to Solid ECN For This Useful Post:
Unregistered (1)
-
Senior Member
- Join Date
- Oct 2022
- Posts
- 1,248
- Thanks
- 1
- Thanked 1,818 Times in 593 Posts
Sensex Shatters Records with New Peak
Solid ECN – The Indian stock market experienced a remarkable surge, with the Sensex, a major stock market index, reaching an unprecedented high. Early on Thursday, it soared by 910.0 points, a 1.3% increase, setting a new record at 70,548.4. The Nifty index also performed impressively, surpassing the 21,100 mark. This surge was primarily influenced by a positive trend in Wall Street, which followed the Federal Reserve's decision to maintain its interest rate for the third consecutive time. Moreover, the Fed hinted at the possibility of rate cuts in the coming year.
The BSE Sensex, which had a rather quiet performance on Wednesday, rebounded with significant gains. These gains were mostly seen in sectors like IT, real estate, banking, and financial services. Investors are now keenly anticipating data from China, expected on Friday. This data includes important metrics like retail sales and industrial output for November 2023.
Market participants are also looking forward to the release of India's wholesale price figures for November. There's a general expectation that India's wholesale prices might register a rise for the first time in eight months. Among the stocks that saw early gains were LTMindtree with a 3.0% increase, HCL Tech with a 2.8% rise, and Bajaj Finance also up by 2.8%. State Bank of India (SBI) also saw a 1.2% increase after its announcement of entering into a significant Line of Credit with the German Development Bank KfW, aimed at supporting solar projects in India.Though trading on financial markets involves high risk, it can still generate extra income in case you apply the right approach. By choosing a reliable broker such as InstaForex you get access to the international financial markets and open your way towards financial independence. You can sign up here.
-
The Following User Says Thank You to Solid ECN For This Useful Post:
Unregistered (1)
-
Senior Member
- Join Date
- Oct 2022
- Posts
- 1,248
- Thanks
- 1
- Thanked 1,818 Times in 593 Posts
USDCHF Tests Ichimoku Cloud: Bulls and Bears in Balance
Solid ECN – The USDCHF currency pair recently tested the Ichimoku cloud after it successfully crossed above it on December 8. This breakout was marked by a long-bodied bullish candle, signaling the bulls' determination to reverse the trend. However, the bullish momentum has since weakened, and the pair is now hovering close to the cloud. Despite this slowdown, the USDCHF buyers still have a chance to push the price towards the 38.2% resistance level. For this to happen, the price needs to remain above the cloud or not fall below the low of November 12.

Conversely, if the USDCHF bears, who appear to be more active than the bulls, manage to push the price below the cloud, the downtrend is likely to resume. In this scenario, the initial target would be the 0.86657 mark.Though trading on financial markets involves high risk, it can still generate extra income in case you apply the right approach. By choosing a reliable broker such as InstaForex you get access to the international financial markets and open your way towards financial independence. You can sign up here.
-
The Following User Says Thank You to Solid ECN For This Useful Post:
Unregistered (1)
-
Senior Member
- Join Date
- Oct 2022
- Posts
- 1,248
- Thanks
- 1
- Thanked 1,818 Times in 593 Posts
USDCAD Tests Key Support Levels
Solid ECN - The USDCAD currency pair crossed above the Ichimoku cloud on November 12. Currently, it's testing the cloud for support, a level that coincides with the broken bearish channel.
Technical indicators are hinting at a potential bearish trend. Yet, as long as the USDCAD pair trades above the bullish trendline (depicted in red), we can anticipate a price increase. If this trend continues, the next bullish goal might be the 50% level of the Fibonacci retracement tool.

On the flip side, should the USDCAD pair close and stabilize below the cloud, it would invalidate the bullish analysis. In such a case, the bears' initial target could be the November low, marked at 1.34781.Though trading on financial markets involves high risk, it can still generate extra income in case you apply the right approach. By choosing a reliable broker such as InstaForex you get access to the international financial markets and open your way towards financial independence. You can sign up here.
-
The Following User Says Thank You to Solid ECN For This Useful Post:
Unregistered (1)
-
Senior Member
- Join Date
- Oct 2022
- Posts
- 1,248
- Thanks
- 1
- Thanked 1,818 Times in 593 Posts
Understanding the Bearish Signals in the AUDUSD Marke
Soldi ECN – The AUDUSD currency pair is currently trading below the Ichimoku cloud, indicating a potential shift from a bullish to a bearish trend. However, the pair has not yet fallen below the November high of 0.6525. This resistance led to a surge in the AUDUSD price, causing it to test the cloud for the second time this month. Presently, the pair is fluctuating within a bearish flag pattern, suggesting that a breach below the 0.6525 support level is probable. If this occurs, the next target for the bears could be the 161.8% Fibonacci support, followed by the lower band of the trading channel.

On the other hand, as long as the AUDUSD pair remains below the Ichimoku cloud, the overall trend is considered bearish. This suggests that traders should be cautious, as the market could continue to follow a downward trajectory.Though trading on financial markets involves high risk, it can still generate extra income in case you apply the right approach. By choosing a reliable broker such as InstaForex you get access to the international financial markets and open your way towards financial independence. You can sign up here.
-
The Following User Says Thank You to Solid ECN For This Useful Post:
Unregistered (1)
-
Senior Member
- Join Date
- Oct 2022
- Posts
- 1,248
- Thanks
- 1
- Thanked 1,818 Times in 593 Posts
GBPUSD's Challenge with the Ichimoku Cloud: A Bearish Outlook
Solid ECN Blog – The GBPUSD currency pair recently faced a setback, unable to break through the Ichimoku cloud. Following this, it dropped back under the 23.6% Fibonacci level. When we look at the technical indicators, there's a clear signal. The Relative Strength Index (RSI) is lingering below 50. Meanwhile, the Average Directional Index (ADX) suggests a weak trend, though its bearish line is rising above 20. Additionally, the Awesome Oscillator's bars have switched to red, indicating a bearish trend. These indicators collectively point in one direction: they suggest that the downtrend for GBPUSD is likely to continue.

What's Next for GBPUSD?As long as GBPUSD remains below the Ichimoku cloud, we can expect the bearish trend to persist. The first target for this downward trend would be the 38.2% Fibonacci support level.
On the other hand, if the pair manages to rise above the Ichimoku cloud, it would invalidate the current bearish scenario.Though trading on financial markets involves high risk, it can still generate extra income in case you apply the right approach. By choosing a reliable broker such as InstaForex you get access to the international financial markets and open your way towards financial independence. You can sign up here.
-
The Following User Says Thank You to Solid ECN For This Useful Post:
Unregistered (1)
-
Senior Member
- Join Date
- Oct 2022
- Posts
- 1,248
- Thanks
- 1
- Thanked 1,818 Times in 593 Posts
EURUSD Faces Key Fibonacci Resistance: What's Next?
Solid ECN – The EURUSD currency pair recently encountered the 38.2% Fibonacci resistance level. This significant resistance is further reinforced by the presence of the Ichimoku Cloud. As long as the EURUSD price remains below this 38.2% level, the bearish outlook continues to be relevant. Currently, if the bearish trend persists, the next objective for sellers could be the low experienced in December. Following that, the lower boundary of the established bearish channel could be the subsequent target.

Though trading on financial markets involves high risk, it can still generate extra income in case you apply the right approach. By choosing a reliable broker such as InstaForex you get access to the international financial markets and open your way towards financial independence. You can sign up here.
-
Senior Member
- Join Date
- Oct 2022
- Posts
- 1,248
- Thanks
- 1
- Thanked 1,818 Times in 593 Posts
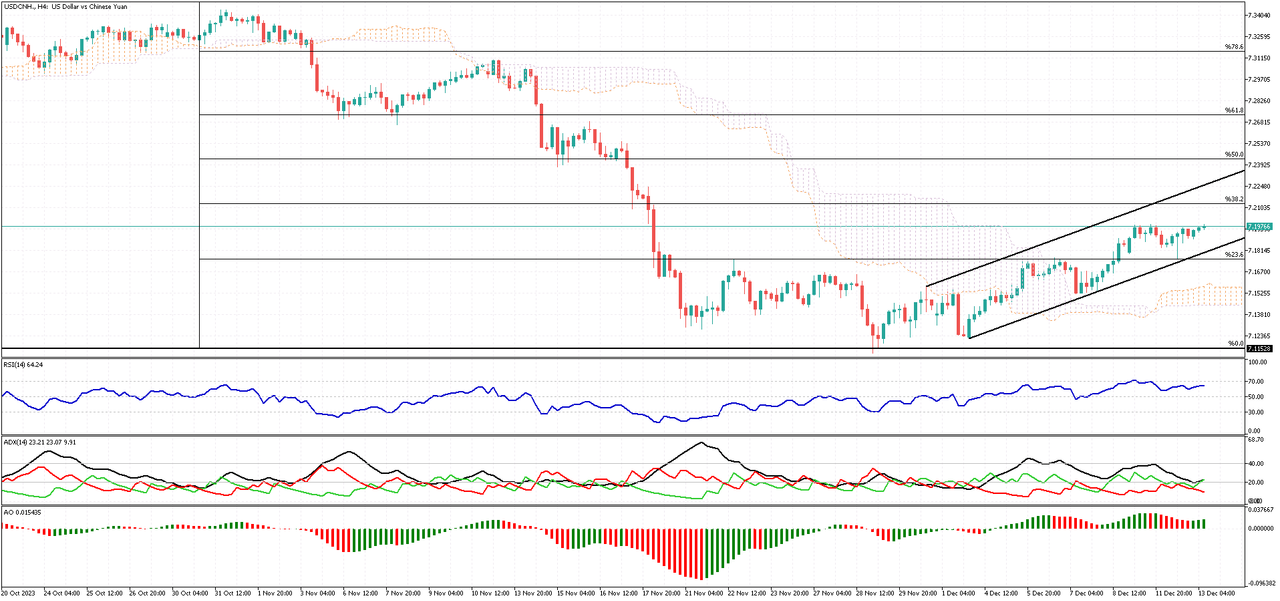
Understanding the Offshore Yuan's Recent Dip
Solid ECN – Recently, there has been a notable decrease in the value of the Chinese Yuan in international markets. Specifically, the offshore yuan's value has dropped, approaching 7.2 against the US dollar. This change marks a significant low point for the currency, as it hasn't been this low in over three weeks. This decline occurred following a major policy meeting held by top Chinese officials. In this meeting, the officials discussed and set economic goals for the upcoming year. However, their announcements did not significantly encourage or uplift the market. One key point was the lack of a precise target for economic growth. Instead, the focus was on increasing domestic demand through a variety of fiscal and monetary policies.
The Economic Indicators
Investors are now keenly anticipating several important economic indicators from China. These include upcoming data on industrial production, retail sales, and unemployment figures. Additionally, there's a heightened interest in the decisions regarding the medium-term lending rates by the People’s Bank of China, scheduled for the following week.
Recent Economic Data
Compounding the situation, recent economic data from China has shown some concerning trends. Consumer prices in the country decreased by 0.5% year-on-year in November, a more significant drop than the previous month and worse than what was predicted. Moreover, producer prices also fell by 3% last month. This decline has been ongoing for 14 months and is the most rapid since August.
Economic Implications
The Yuan's depreciation could have mixed effects on the Chinese economy. On one hand, a weaker Yuan makes Chinese exports more competitive in global markets, potentially boosting export-driven sectors. However, it also indicates underlying concerns about the health of the domestic economy, particularly in terms of domestic demand and industrial productivity.Though trading on financial markets involves high risk, it can still generate extra income in case you apply the right approach. By choosing a reliable broker such as InstaForex you get access to the international financial markets and open your way towards financial independence. You can sign up here.
Results 401 to 410 of 1264


 Reply With Quote