 Thread:


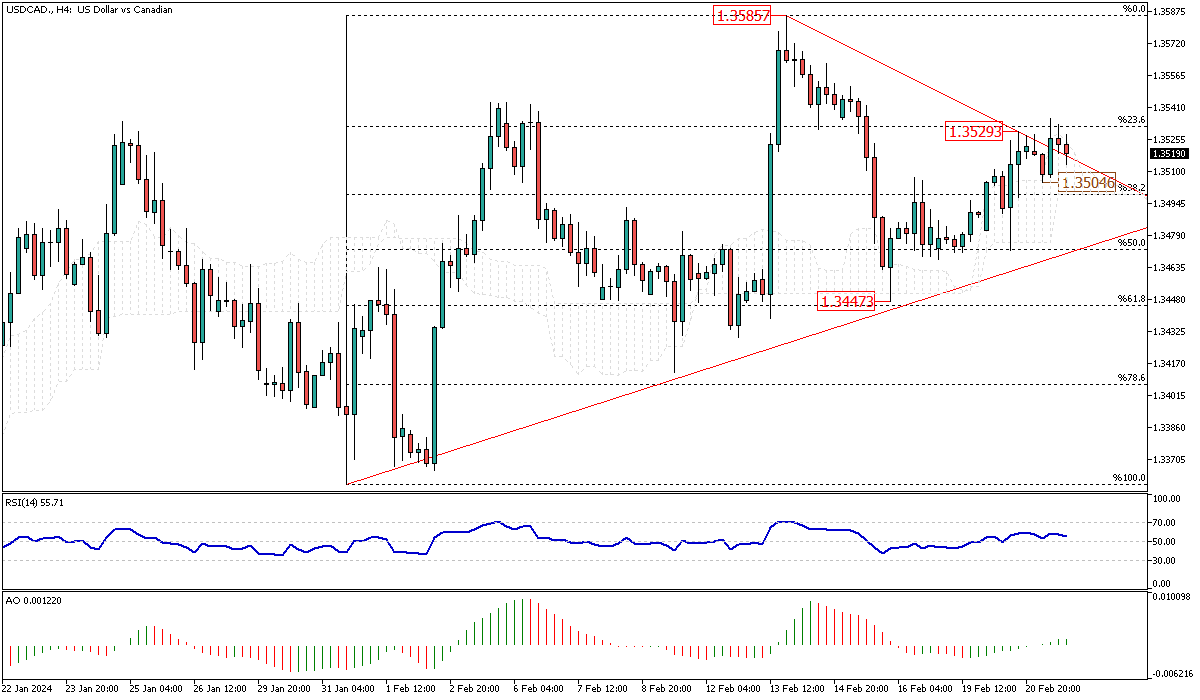
USDCAD Price Analysis: Testing 23.6% Fibonacci Resistance
When writing, the USDCAD price is 1.352, slightly below the 23.6% Fibonacci resistance currently under test. The technical indicators are bullish, with the RSI floating above 50, and the AO bars are green beyond the signal line.
From a technical standpoint, the bulls must break the 1.3529 resistance for the primary uptrend to continue. If this scenario unfolds, the next bullish target will be the February higher high at 1.3585.
On the flip side, if the USDCAD price falls below the 1.3504 mark, the decline would extend to the 50% Fibonacci resistance. This is where the ascending trendline supports the trend. It’s worth noting that as long as this trendline remains unbroken, the primary USDCAD trend should be considered bullish.
Malaysia Forex Forum
- Forum
- Forex Charts
- Monitoring
- Forex TV

-
Senior Member


- Join Date
- Oct 2022
- Posts
- 1,194
- Thanks
- 1
- Thanked 1,564 Times in 522 Posts
Though trading on financial markets involves high risk, it can still generate extra income in case you apply the right approach. By choosing a reliable broker such as InstaForex you get access to the international financial markets and open your way towards financial independence. You can sign up here.
-
Senior Member
- Join Date
- Oct 2022
- Posts
- 1,194
- Thanks
- 1
- Thanked 1,564 Times in 522 Posts
USDJPY Trades in Ascending Channel Amid Bullish Indications

Solid ECN – The USDJPY pair trades within an ascending channel, indicating that traders should seek extended opportunities rather than short ones. However, the price has been fluctuating within a bearish flag, depicted in red, since February 13th. Meanwhile, the technical indicators don't provide valuable data on the next market move. The RSI indicator is clinging to the middle line, while the AO bars are small, with a slight increase in the green bars.
From a technical standpoint, the lower band of the bullish flag, depicted in blue, serves as support for the primary trend, which is bullish. As long as the USDJPY price remains within the flag, the ultimate forecast is an increase in the value of the U.S. dollar against the Japanese yen. In this scenario, the bulls must close above the 159.4 resistance for the uptrend to resume. Otherwise, the weak bearish momentum seen on the chart might extend to the lower band of the flag. It's worth noting that the 148.9 resistance area offers a better entry point than the current market value, which is 150 at the time of writing.Though trading on financial markets involves high risk, it can still generate extra income in case you apply the right approach. By choosing a reliable broker such as InstaForex you get access to the international financial markets and open your way towards financial independence. You can sign up here.
-
Senior Member
- Join Date
- Oct 2022
- Posts
- 1,194
- Thanks
- 1
- Thanked 1,564 Times in 522 Posts
USDCAD Tests Fibonacci Resistance Amid Bullish Wave

Solid ECN – The USDCAD pair is testing the 23.6% Fibonacci resistance at the 1.3529 mark, following the bullish wave that began on February 15th from the 1.3447 mark, the 61.8% Fibonacci support level. The 4-hour chart shows that the bulls have crossed above the bearish trendline with a long-bodied candlestick. This could be interpreted as a continuation of the uptrend momentum. Interestingly, the technical indicators back up this momentum, with the relative strength index pointing upwards and the awesome oscillator flipping above the signal line.
From a technical standpoint, the U.S. dollar is likely to gain more against the Canadian dollar, and the next target for the buyers could be the 1.3585 resistance.
On the flip side, the bullish trendline is the primary support for the uptrend. The uptrend scenario outlined above should be invalidated if the price falls below this level corresponding to the 50% Fibonacci level or the 1.3471 mark.Though trading on financial markets involves high risk, it can still generate extra income in case you apply the right approach. By choosing a reliable broker such as InstaForex you get access to the international financial markets and open your way towards financial independence. You can sign up here.
-
Senior Member
- Join Date
- Oct 2022
- Posts
- 1,194
- Thanks
- 1
- Thanked 1,564 Times in 522 Posts
USDCHF Bullish Trend Supported by Ichimoku Cloud

Solid ECN - The USDCHF currency pair trades sideways above the 0.8782 resistance level inside the Ichimoku cloud. It's worth mentioning that the Ichimoku cloud adds an extra layer of support to the bullish trend that began on February 2 from the 0.8852 mark. The technical indicators on the 4-hour chart don't provide significant data, so we should rely on the horizontal channel depicted in blue on the 4-hour chart.
From a technical standpoint, the upward trend on the 4-hour chart should continue if the bulls cross above the 0.8839 level. This scenario is likely due to the primary USDCHF trend and the awesome oscillator bar turning green in the current trading session.
Conversely, the bears need to stabilize the price below the 0.8782 support to target the 38.2% Fibonacci level. If this scenario comes into play, the high of February 12 can be considered the new higher high, and the price might experience a further decline to the 50% Fibonacci retracement level.Though trading on financial markets involves high risk, it can still generate extra income in case you apply the right approach. By choosing a reliable broker such as InstaForex you get access to the international financial markets and open your way towards financial independence. You can sign up here.
-
Senior Member
- Join Date
- Oct 2022
- Posts
- 1,194
- Thanks
- 1
- Thanked 1,564 Times in 522 Posts
Saudi Arabia's Dec 2023 Trade Surplus Dips Amid Lower Sales
Solid ECN - In December 2023, Saudi Arabia's trade surplus shrank to SAR 38.2 billion from SAR 44.2 billion the year before. The country's exports dropped by 9.7% to SAR 98.5 billion, mainly due to a 15.8% decrease in oil product sales, which make up 73.1% of total exports. Also, non-oil product exports decreased by 3% to SAR 19.15 billion, with a significant fall in plastics and rubber goods sales by 7.6%.
The main export destinations were China (14.8%), Japan (11%), and India (8.8%). On the other hand, imports decreased by 7.1% to SAR 60.4 billion, though there was a rise in the intake of machinery, appliances, and electrical gear by 21.5% and transportation equipment by 20%. China was the largest source of imports, accounting for 21%, followed by the US (8.1%) and UAE (7.8%).Though trading on financial markets involves high risk, it can still generate extra income in case you apply the right approach. By choosing a reliable broker such as InstaForex you get access to the international financial markets and open your way towards financial independence. You can sign up here.
-
Senior Member
- Join Date
- Oct 2022
- Posts
- 1,194
- Thanks
- 1
- Thanked 1,564 Times in 522 Posts
GBPJPY Crosses Minor Resistance

Solid ECN – The GBPJPY currency pair has crossed above the 189.5 minor resistance in the 4-hour chart and is currently testing the broken resistance. The GBPJPY chart above shows that the bulls have successfully stabilized the price above the 23.6% Fibonacci support. Furthermore, the technical indicators are supporting the current bullish trend. The RSI indicator hovers above 50, while the AO (Awesome Oscillator) bars are green and positioned above the signal line.
From a technical standpoint, as long as the GBPJPY trades above the ascending trendline, depicted in blue, the trend will remain bullish and likely aim to break the 190.0 ceilings.
On the flip side, if the price falls and stabilizes below the 23.6% Fibonacci support, the decline from February 12 from the 190.0 mark would extend to the 38.2% Fibonacci retracement level, followed by the 50% level.Though trading on financial markets involves high risk, it can still generate extra income in case you apply the right approach. By choosing a reliable broker such as InstaForex you get access to the international financial markets and open your way towards financial independence. You can sign up here.
-
Senior Member
- Join Date
- Oct 2022
- Posts
- 1,194
- Thanks
- 1
- Thanked 1,564 Times in 522 Posts
Australian Dollar Stabilizes Above Fibonacci Support Against U.S. Dollar

Solid ECN - The Australian dollar stabilizes the price above the 23.6% Fibonacci support level against the U.S. Dollar. Currently, the AUDUSD pair is trading around 0.655. The technical indicators signal a continuation of the bullish bias that began on February 13th. The RSI indicator floats above 50, and the awesome oscillator bar in the 4-hour chart turned green. Meanwhile, 0.6497 serves to support the upward trend. The next likely bullish target will be the 38.2% Fibonacci retracement level, corresponding to the 0.662 resistance area.
On the other hand, if the AUDUSD price falls below the ascending trendline, depicted in red, the bullish scenario could be invalidated. In this case, the U.S. Dollar would likely test the 0.6442 support.Though trading on financial markets involves high risk, it can still generate extra income in case you apply the right approach. By choosing a reliable broker such as InstaForex you get access to the international financial markets and open your way towards financial independence. You can sign up here.
-
Senior Member
- Join Date
- Oct 2022
- Posts
- 1,194
- Thanks
- 1
- Thanked 1,564 Times in 522 Posts
GBPUSD Price Decline: Ichimoku Cloud and Channel Analysis

Solid ECN - The GBPUSD price has declined from 1.2629, which aligns with the Ichimoku cloud and the descending trendline, depicted in red. The pair is currently testing the 23.6% Fibonacci support level, which appears weak and may not keep the price from falling. Moreover, the technical indicators support the bearish market, with the RSI indicator hovering below the middle line and the Awesome Oscillator flipping below the signal line.
From a technical standpoint, the downtrend will likely continue as long as the GBPUSD price maintains a position below the 1.2629 resistance. The next target could be 1.2550, followed by 1.2517, the lower low of February 5th.
On the flip side, to invalidate the bearish scenario, the bulls must close and stabilize the price above 1.2629.Though trading on financial markets involves high risk, it can still generate extra income in case you apply the right approach. By choosing a reliable broker such as InstaForex you get access to the international financial markets and open your way towards financial independence. You can sign up here.
-
Senior Member
- Join Date
- Oct 2022
- Posts
- 1,194
- Thanks
- 1
- Thanked 1,564 Times in 522 Posts
Solid ECN: Safeguard Assets Amid Inflation
Experience the power of financial security with Solid ECN’s innovative solution for inflation! At Solid ECN Securities, we understand your concerns about inflation and have crafted the perfect solution. We offer multiple wallets to our esteemed customers, enabling them to safeguard their assets, investments, and profits in the most sought-after currencies and cryptocurrencies.
Euro Wallet
US Dollar Wallet
Pound Sterling Wallet
With Solid ECN, you can trade over 250 products using a Bitcoin-based account in a genuine ECN environment! It’s time to embrace the future of trading.
Join the Solid ECN family today and discover the best platform for trading Forex, commodities, indices, and currencies. Your journey towards financial growth starts here!
https://solidecn.com
%15 Bonus | Swap Free | Raw Spread | RegulatedThough trading on financial markets involves high risk, it can still generate extra income in case you apply the right approach. By choosing a reliable broker such as InstaForex you get access to the international financial markets and open your way towards financial independence. You can sign up here.
-
Senior Member
- Join Date
- Oct 2022
- Posts
- 1,194
- Thanks
- 1
- Thanked 1,564 Times in 522 Posts
AUDUSD Price Analysis: Testing Fibonacci and Trendline Resistance

Solid ECN - The AUDUSD price stands at 0.653 at the time of writing. Currently, the pair is testing the 0.654 high, which aligns with the 23.6% Fibonacci level. Interestingly, the bulls have managed to cross above the descending trendline, depicted in blue, and are now attempting to stabilize above this level. Regarding technical indicators, they promise a continuation of the uptick momentum that began on February 13th, starting from the 0.6442 lower low.
From a technical standpoint, if the price holds above the ascending trendline, depicted in red, the bulls will likely rise and test the 0.6623 resistance, backed up by the 38.2% Fibonacci level.
Conversely, the bullish scenario would be invalidated if the AUDUSD price falls below the ascending trendline, precisely the 0.6497 mark.Though trading on financial markets involves high risk, it can still generate extra income in case you apply the right approach. By choosing a reliable broker such as InstaForex you get access to the international financial markets and open your way towards financial independence. You can sign up here.
Results 161 to 170 of 1210

 Reply With Quote