 Thread:


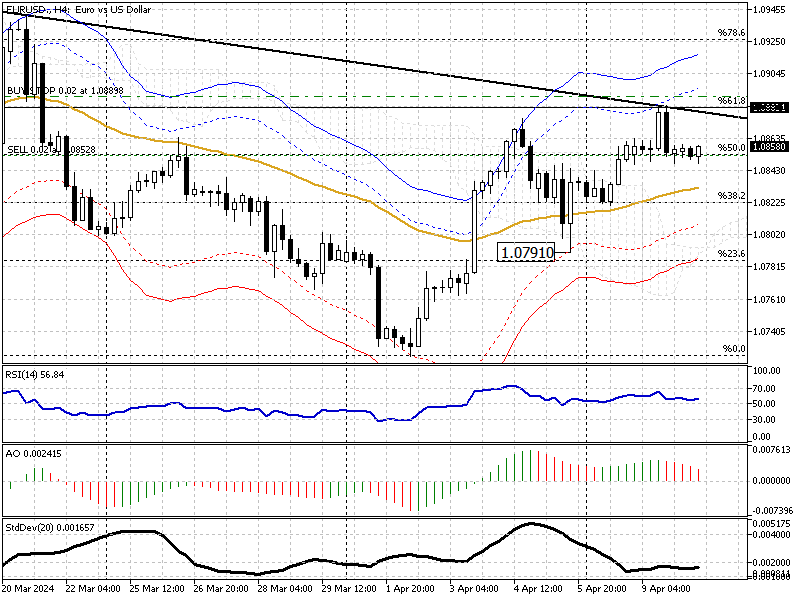
EURUSD Trends: A Shift Below Key Levels This Week
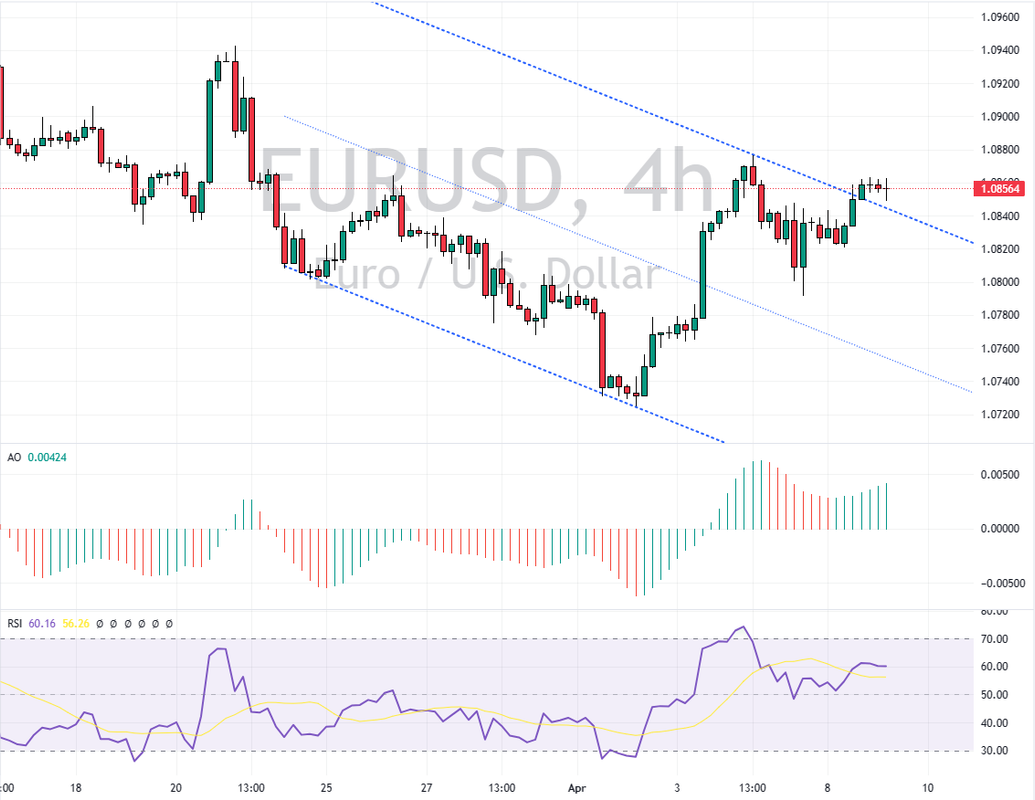
Solid ECN – In the 4-hour chart, the EURUSD currency pair trades under the descending trendline, shown in black. This position came about after the pair developed a bearish engulfing pattern right around the 61.8% Fibonacci support level, suggesting the possibility of a trend change. At the same time, the awesome oscillator gives off a divergence signal, matching what the candlestick pattern indicates.
The pair must end below the 50 EMA for the downtrend to press on. If this happens, we could see the price heading towards the 23.6% Fibonacci support level, marking it as the initial goal for this week.
However, should the EURUSD pair's price climb above the 61.8% Fibonacci resistance level, the current bearish market analysis might no longer be applicable.
Malaysia Forex Forum
- Forum
- Forex Charts
- Monitoring
- Forex TV

-
Senior Member


- Join Date
- Oct 2022
- Posts
- 1,166
- Thanks
- 1
- Thanked 1,561 Times in 522 Posts
Though trading on financial markets involves high risk, it can still generate extra income in case you apply the right approach. By choosing a reliable broker such as InstaForex you get access to the international financial markets and open your way towards financial independence. You can sign up here.
-
Senior Member
- Join Date
- Oct 2022
- Posts
- 1,166
- Thanks
- 1
- Thanked 1,561 Times in 522 Posts
EURUSD Steady at $1.08 as ECB Meeting Nears, Rate Cut Hints Awaited
Solid ECN – The euro remained steady at about $1.08, with investors taking a careful stance as they awaited Thursday's European Central Bank (ECB) announcement.
It's widely anticipated that ECB officials will keep interest rates at their current record highs for the sixth time in a row. The focus is now on how the statement is worded and what ECB President Lagarde might say in her press conference to hint at when the first interest rate decrease of the year could happen.
Recent documents from the ECB show that the officials are more confident about inflation moving towards their goal of 2%, which makes a strong argument for a reduction in interest rates. On the other hand, the US dollar kept getting support because the latest data showed the American job market is still doing well, indicating that the Federal Reserve might not hurry to lower interest rates soon.Though trading on financial markets involves high risk, it can still generate extra income in case you apply the right approach. By choosing a reliable broker such as InstaForex you get access to the international financial markets and open your way towards financial independence. You can sign up here.
-
Senior Member
- Join Date
- Oct 2022
- Posts
- 1,166
- Thanks
- 1
- Thanked 1,561 Times in 522 Posts
EURUSD Market Update
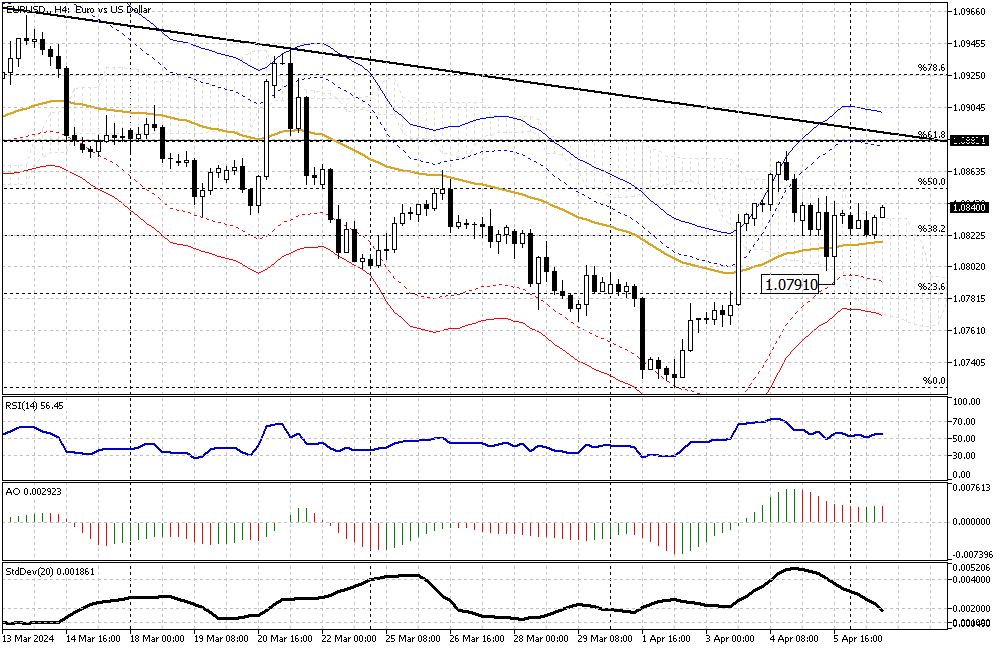
Solid ECN – In Monday's trading session, the Euro trades at about 1.083 against the U.S. Dollar, which is slightly above the EMA 50 and the 38.2% Fibonacci support level. It seems the pair is trying to stabilize itself above the aforementioned level after pulling back from the 23.6% Fibonacci level in Friday's late trading session.
The technical indicators give mixed signals, but the Standard Deviation indicates low activity and sideways momentum in the EURUSD market. That said, with the RSI (Relative Strength Index) hovering above 50, the price of the EURUSD might grow higher to test the 50% Fibonacci level followed by the 1.088 strong resistance area.
However, entering the market with a bullish outlook is risky since the primary trend is bearish. Therefore, it is recommended to wait and monitor the price action closely near the key levels mentioned above and seek opportunities to join the bear market.
From a technical standpoint, if the price rises to the 1.088 resistance, it would offer a decent price to go short on the EURUSD pair if the 4-hour chart forms a bearish candlestick pattern.
On the other hand, if the Euro dips below the EMA 50, this could signal a continuation in the downtrend, and retail traders can adjust their strategies accordingly and join the primary trend, which is bearish.Though trading on financial markets involves high risk, it can still generate extra income in case you apply the right approach. By choosing a reliable broker such as InstaForex you get access to the international financial markets and open your way towards financial independence. You can sign up here.
-
Senior Member
- Join Date
- Oct 2022
- Posts
- 1,166
- Thanks
- 1
- Thanked 1,561 Times in 522 Posts
Pound Sterling's High Against Dollar & Future Trends

Solid ECN – Yesterday, the pound sterling reached its highest level against the U.S. Dollar for April, climbing to 1.268. When looking at the GBPUSD 4-hour chart, we see a candlestick with a long wick, peaking at 1.268. This peak is near the top edge of a falling flag pattern and is backed by the Ichimoku cloud and the 38.2% Fibonacci retracement level.
This area of strong resistance halted the pound's upward movement, leading to a rebound by the U.S. Dollar. Currently, the GBPUSD is trading around the 50-day Exponential Moving Average (EMA), at approximately 1.263.
From a technical perspective, the currency pair is in a downtrend. If the price remains below the 50 EMA, we might see this downward trend continue. In such a case, the next target for the bears might be April's lowest point, at 1.2539.
However, if the GBPUSD price can rise above the 38.2% Fibonacci level or the 1.268 mark, it would signal a potential shift away from the downtrend. This possibility seems less likely, as the technical indicators lean towards a continuation of the bear market.Though trading on financial markets involves high risk, it can still generate extra income in case you apply the right approach. By choosing a reliable broker such as InstaForex you get access to the international financial markets and open your way towards financial independence. You can sign up here.
-
Senior Member
- Join Date
- Oct 2022
- Posts
- 1,166
- Thanks
- 1
- Thanked 1,561 Times in 522 Posts
AUDUSD Climbs Higher: A Look into the Bullish Trend
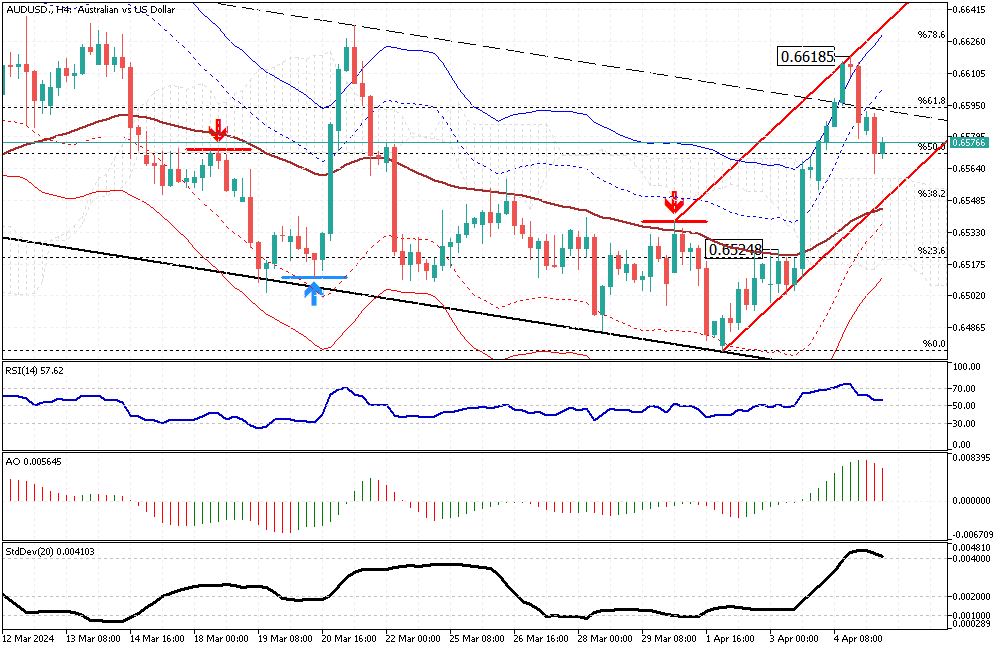
Solid ECN – Yesterday, the Australian dollar saw a significant rise against the U.S. dollar. This increase in value started when it surpassed the EMA 50 and reached 0.6524, marked by a large bullish candle. Following this, there were four more strong bullish candles, pushing the price beyond the Envelopes band, suggesting the market was in an overbought state. This was further supported by the RSI indicator moving above 70.
Today, the market is correcting itself slightly after reaching a high of 0.661 on Thursday. Currently, the AUD/USD pair is trading around 0.657, still above the 50% Fibonacci support level, and maintaining its position over the Ichimoku Cloud. Despite technical indicators showing a bearish trend, the overall outlook remains bullish as long as the price stays above the cloud and the EMA 50.
The AUD/USD price might climb further to challenge the 78.6% Fibonacci resistance level at 0.6626, moving towards the top of the bullish channel shown in red on the 4-hour chart for AUD/USD.
However, if the price falls below the EMA 50 or the 38.2% Fibonacci support level at 0.5548, this would signal an end to the bullish trend.Though trading on financial markets involves high risk, it can still generate extra income in case you apply the right approach. By choosing a reliable broker such as InstaForex you get access to the international financial markets and open your way towards financial independence. You can sign up here.
-
Senior Member
- Join Date
- Oct 2022
- Posts
- 1,166
- Thanks
- 1
- Thanked 1,561 Times in 522 Posts
Bearish Trend in AUD/USD: Key Indicators and Price Targets
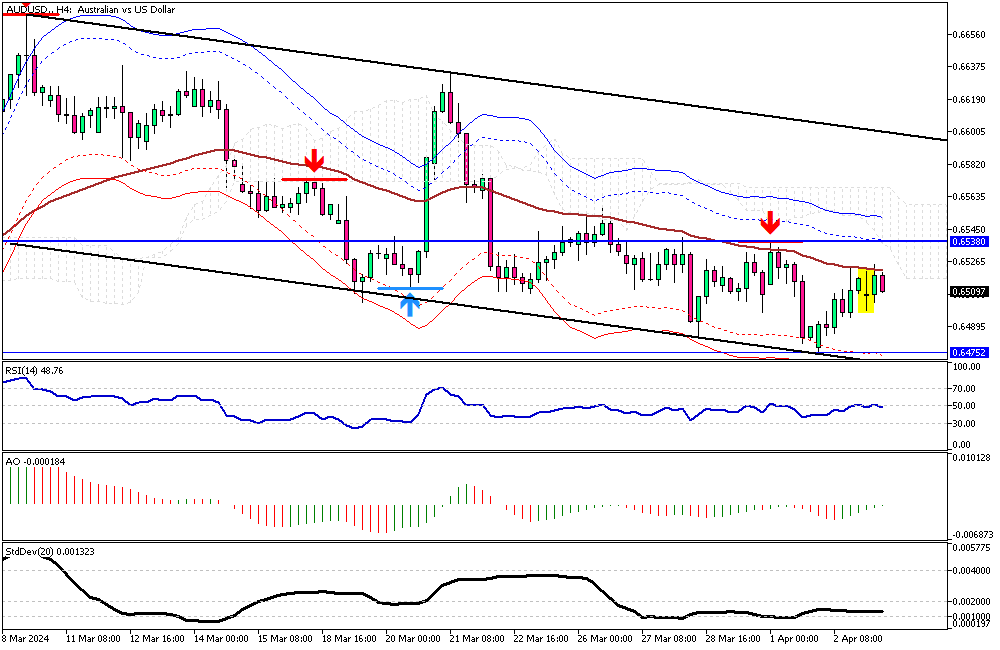
Solid ECN – The momentum of the Australian dollar against the U.S. Dollar has paused in today's trading session. As of this writing, the AUD/USD pair is testing the EMA 50 at about 0.651, which coincides with the Ichimoku Cloud.
The 4-hour chart has formed a Doji candlestick pattern, which could be interpreted as a sign of a trend reversal or a halt to the current uptick in momentum.
From a technical standpoint, as long as the AUD/USD pair trades below the cloud, the primary trend remains bearish. In this scenario, the next target will likely be March's lowest price, the 0.647 mark. Please note that if the Standard Deviation indicator rises above the 0.002 level, the pace of the downtrend will escalate.
On the flip side, the bear market should be invalidated if the price of the Australian dollar closes and stabilizes above the 0.6538 resistance mark. In this case, the rise will likely extend and aim for the upper band of the flag.Though trading on financial markets involves high risk, it can still generate extra income in case you apply the right approach. By choosing a reliable broker such as InstaForex you get access to the international financial markets and open your way towards financial independence. You can sign up here.
-
Senior Member
- Join Date
- Oct 2022
- Posts
- 1,166
- Thanks
- 1
- Thanked 1,561 Times in 522 Posts
Navigating Bitcoin's Consolidation Phase
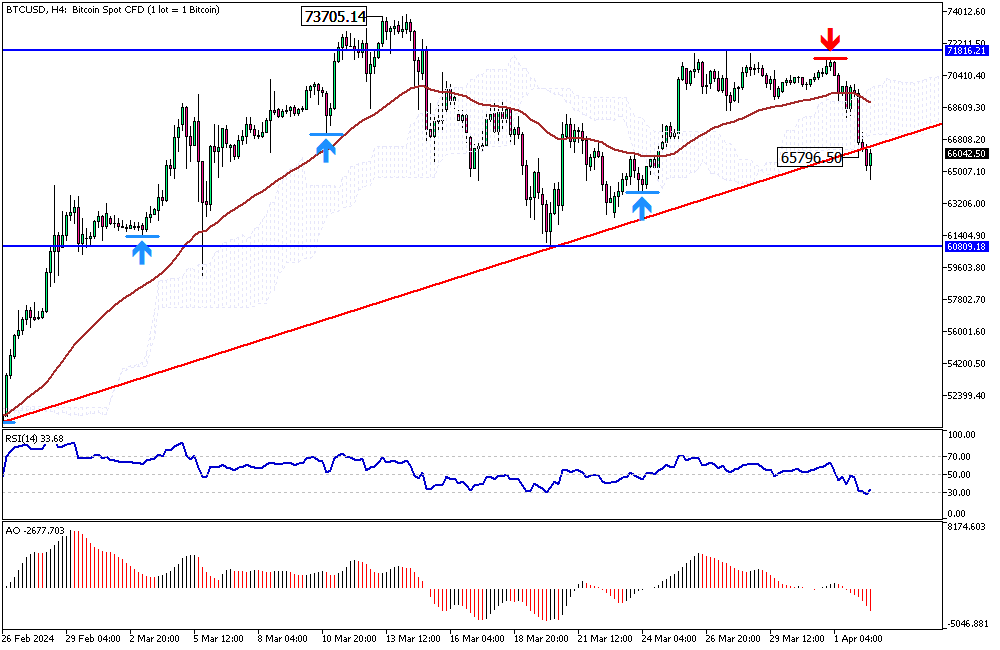
The Bitcoin price dipped below the $65,796 resistance level, which is beneath the ascending trendline and the Ichimoku Cloud. Concurrently, the RSI indicator entered the overbought area, and as a result, the BTCUSD pair is testing the previously broken trendline at the time of writing.
From a technical standpoint, the bullish market has paused, and we are entering a consolidation phase that is likely to extend to the $68,000 resistance area.Though trading on financial markets involves high risk, it can still generate extra income in case you apply the right approach. By choosing a reliable broker such as InstaForex you get access to the international financial markets and open your way towards financial independence. You can sign up here.
-
Senior Member
- Join Date
- Oct 2022
- Posts
- 1,166
- Thanks
- 1
- Thanked 1,561 Times in 522 Posts
USD/JPY Eyes Key 151.9 Resistance Level
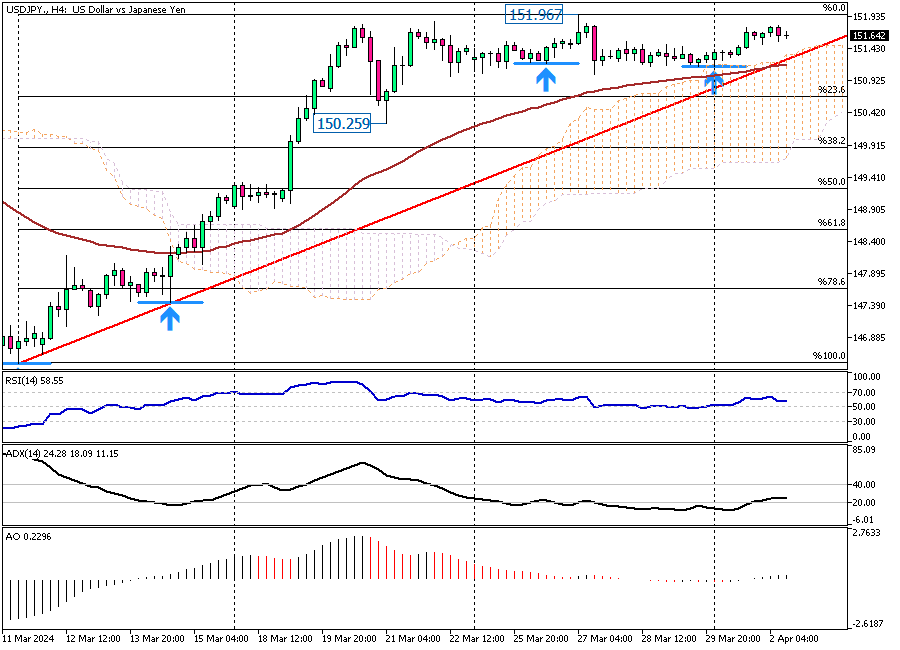
Solid ECN – The U.S. Dollar trades slightly lower than the 151.9 mark against the Japanese yen in today's trading session. The pair has been ranging below this area for two weeks now, and the trend hasn't developed any significant moves lately.
However, bullish traders are keen to see the pair break above the 151.9 ceiling, which could lead to the U.S. price experiencing another jump against the Japanese currency.
Therefore, from a technical standpoint, the primary trend is bullish while the pair hovers above the 23.6% Fibonacci support level. The uptrend will continue if the bulls break above the resistance level, the 151.9 mark.Though trading on financial markets involves high risk, it can still generate extra income in case you apply the right approach. By choosing a reliable broker such as InstaForex you get access to the international financial markets and open your way towards financial independence. You can sign up here.
-
Senior Member
- Join Date
- Oct 2022
- Posts
- 1,166
- Thanks
- 1
- Thanked 1,561 Times in 522 Posts
USDCNH Bullish Trend Analysis: Key Levels to Watch
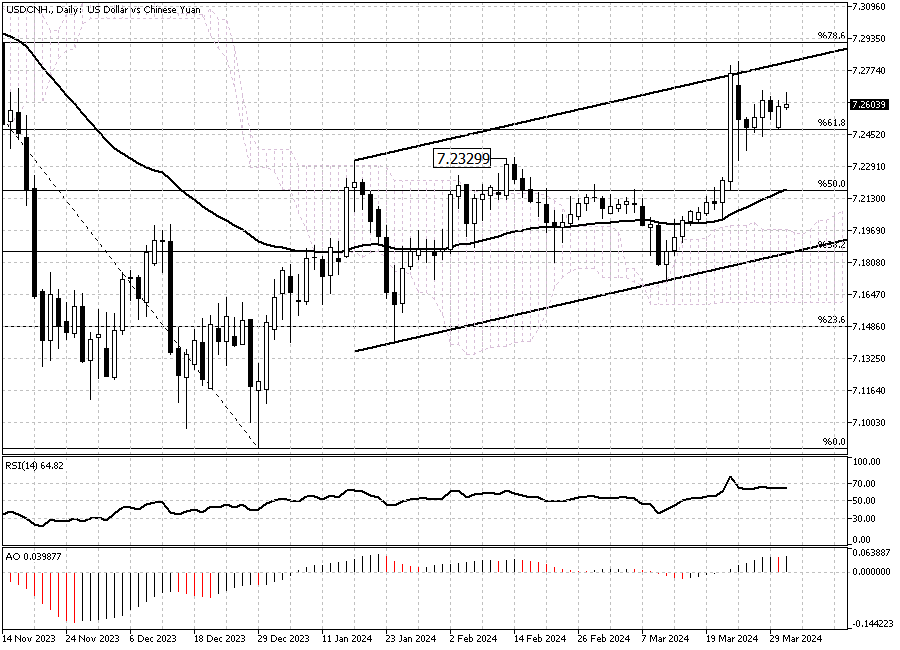
Solid ECN – The U.S. Dollar has been in an uptrend since mid-December 2023 against the Chinese Yuan. As of this writing, the USDCNH pair trades at about 7.26, slightly above the 61.8% Fibonacci support level and the 7.23 higher low.
The technical indicators are bullish. The RSI hovers above the median line and the Awesome Oscillator bars are green and above the signal line.
From a technical standpoint, the pair is in a bull market, with 7.23 acting as support. Therefore, while the price holds above this level, the next bullish target could be the 78.6% Fibonacci resistance level.
Conversely, if the USDCNH price dips below the 7.23 support, the decline is likely to extend to the lower band of the bullish flag, which is in conjunction with the Ichimoku Cloud. Please note that the trend remains bullish as long as the pair ranges above the cloud.Though trading on financial markets involves high risk, it can still generate extra income in case you apply the right approach. By choosing a reliable broker such as InstaForex you get access to the international financial markets and open your way towards financial independence. You can sign up here.
-
Senior Member
- Join Date
- Oct 2022
- Posts
- 1,166
- Thanks
- 1
- Thanked 1,561 Times in 522 Posts
Bitcoin Tests the Bullish Trendline for Next Moves
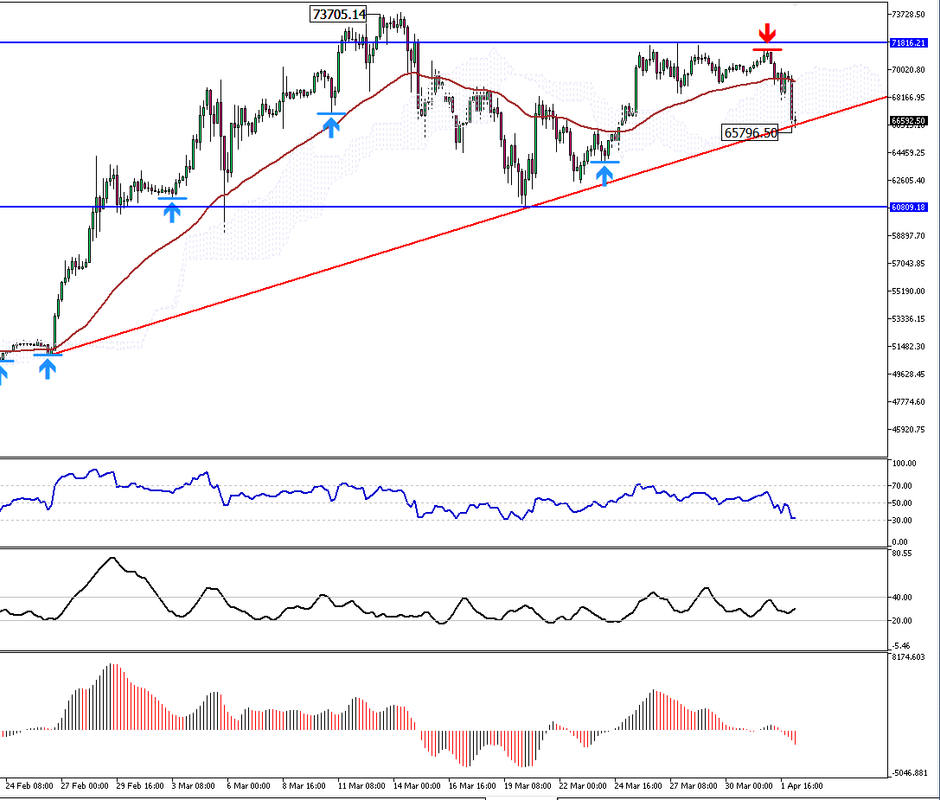
Bitcoin's price dipped to as low as $65,796 in today's trading session against the U.S. dollar. As of this writing, the pair is testing the ascending trendline highlighted in red. The technical indicators are not providing valuable information now, so we focus on price action analysis.
From a technical perspective, the trend remains bullish as long as the price stays above the red trendline. However, if bears push and maintain the BTC/USD price below this trendline, the dip could extend further, with the next bearish target potentially being the $68,000 resistance level.Though trading on financial markets involves high risk, it can still generate extra income in case you apply the right approach. By choosing a reliable broker such as InstaForex you get access to the international financial markets and open your way towards financial independence. You can sign up here.
Results 41 to 50 of 1182

 Reply With Quote