 Thread:


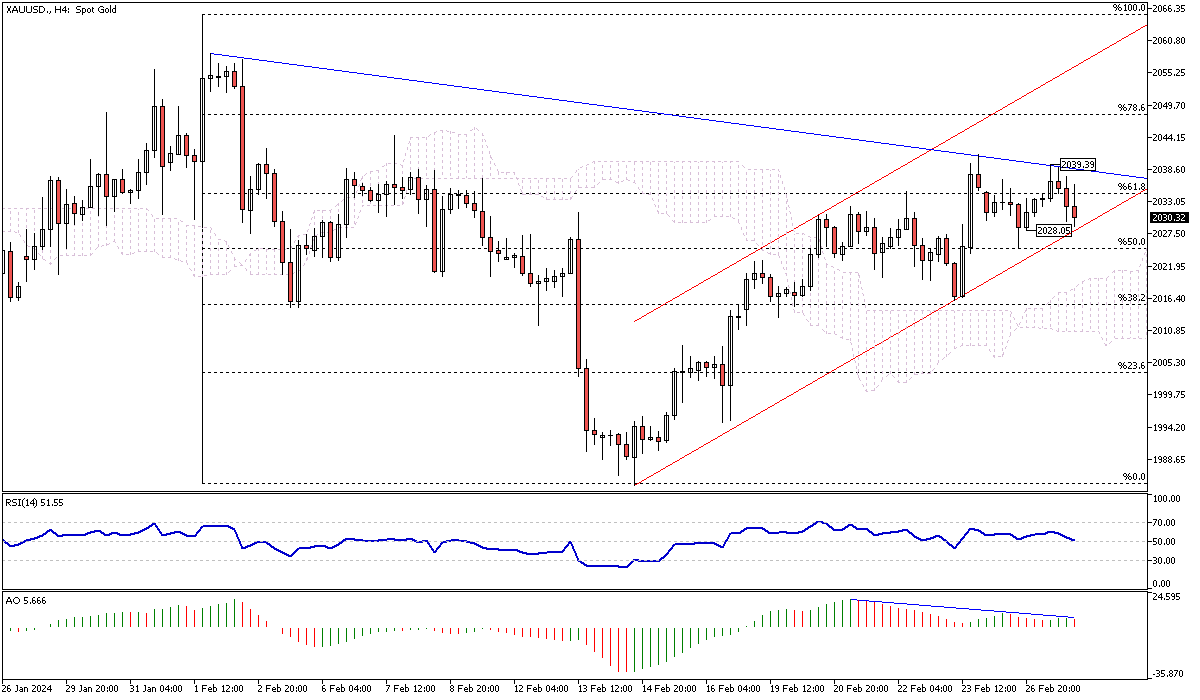
Gold Price Analysis: Potential Bullish Breakout
Solid ECN – The yellow metal is testing the $2,037 mark. What distinguishes this resistance area is its conjunction with the 61.8% Fibonacci level and the descending trendline, depicted in blue.
Upon examining the price action, we observe that the divergence in the awesome oscillator couldn't initiate a shift in the market. Consequently, the Gold price remained above the 50% Fibonacci level and the Ichimoku cloud. With the RSI indicator hovering above the 50 lines, it is likely for the price to make a bullish breakout and climb to the 78.6% Fibonacci resistance, corresponding to the $2,048 mark.
On the other hand, if the XAU/USD price dips and stabilizes below the 50% Fibonacci support, the bullish analysis will be invalidated. In such a scenario, the price might experience a further decline to the 38.2% level.
Malaysia Forex Forum
- Forum
- Forex Charts
- Monitoring
- Forex TV

-
Senior Member


- Join Date
- Oct 2022
- Posts
- 1,166
- Thanks
- 1
- Thanked 1,564 Times in 522 Posts
Though trading on financial markets involves high risk, it can still generate extra income in case you apply the right approach. By choosing a reliable broker such as InstaForex you get access to the international financial markets and open your way towards financial independence. You can sign up here.
-
The Following User Says Thank You to Solid ECN For This Useful Post:
Unregistered (1)
-
Senior Member
- Join Date
- Oct 2022
- Posts
- 1,166
- Thanks
- 1
- Thanked 1,564 Times in 522 Posts
AUDUSD Analysis: Breaking Bullish Trends and Testing Fibo Level
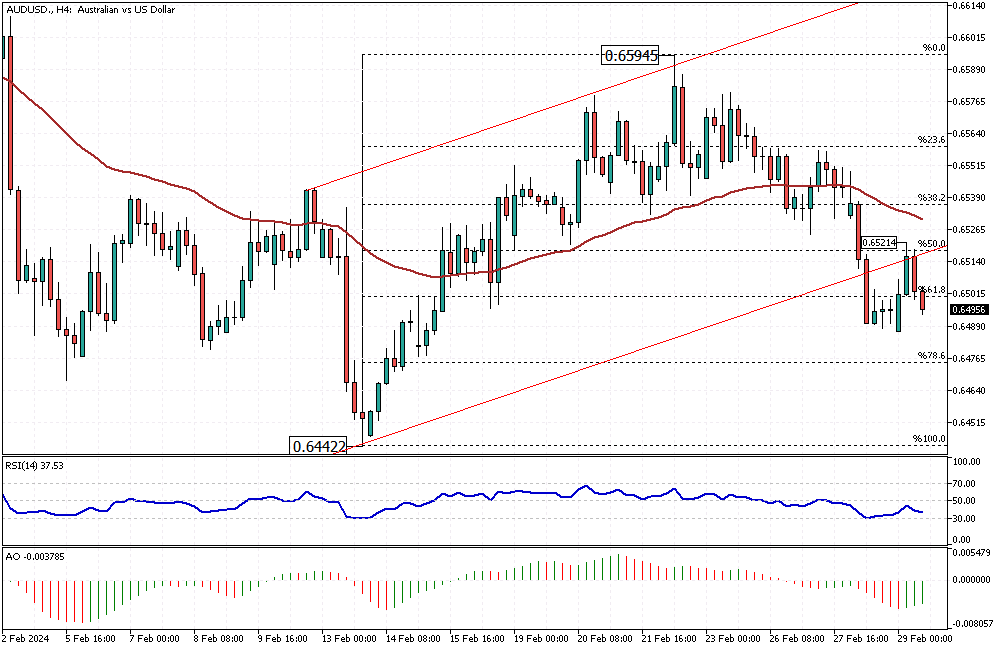
Solid ECN – The U.S. dollar broke below the ascending bullish channel in yesterday's trading session against the Australian dollar. Interestingly, the pair tested the broken support, which now acts as resistance, specifically at the 50% Fibonacci level or the 0.6521 mark.
The technical indicators give mixed signals: the RSI is bearish, while the Awesome Oscillator signals a bull market.
Based on the price action, the 50% Fibonacci level plays as resistance, and it is expected for the downtrend to extend to the 78.6% Fibonacci support, followed by the February low at 0.6442.
The bearish outlook for the AUD/USD pair should be invalidated if the price stabilizes itself above the 50% Fibonacci level.Though trading on financial markets involves high risk, it can still generate extra income in case you apply the right approach. By choosing a reliable broker such as InstaForex you get access to the international financial markets and open your way towards financial independence. You can sign up here.
-
The Following User Says Thank You to Solid ECN For This Useful Post:
Unregistered (1)
-
Senior Member
- Join Date
- Oct 2022
- Posts
- 1,166
- Thanks
- 1
- Thanked 1,564 Times in 522 Posts
Anticipated Rise of Pound Sterling: A Clear Signal from Technical Indicators
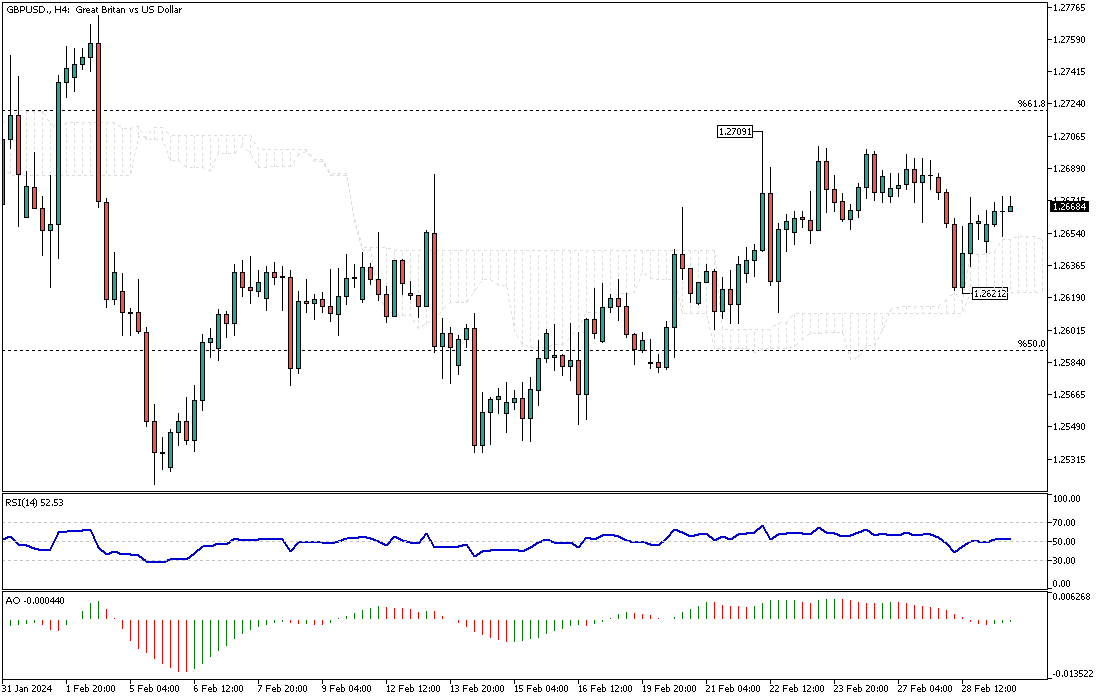
Solid ECN – As anticipated, the pound sterling has once again risen from the support zone of the Ichimoku cloud, the 1.2621 mark. Today, the technical indicators are providing a clearer signal. With the RSI flipping above the median line and the appearance of green bars on the awesome oscillator, we can forecast that the bull market will likely expand further.
The first significant milestone for the bulls is reaching the February high of 1.2709. Interestingly, this resistance level is reinforced by the 61.8% Fibonacci retracement, adding to its significance.
However, it's important to note that if the GBPUSD price falls below the cloud, the validity of the bull market could be called into question. This is a crucial point to remember as we monitor market trends.Though trading on financial markets involves high risk, it can still generate extra income in case you apply the right approach. By choosing a reliable broker such as InstaForex you get access to the international financial markets and open your way towards financial independence. You can sign up here.
-
The Following User Says Thank You to Solid ECN For This Useful Post:
Unregistered (1)
-
Senior Member
- Join Date
- Oct 2022
- Posts
- 1,166
- Thanks
- 1
- Thanked 1,564 Times in 522 Posts
Introducing the Revolutionary Solid-Micro Account: Tailored for Every Trader
Discover the ultimate trading experience with our Solid-Micro Account, designed to cater to both novices and seasoned professionals in the Forex market. Our standout feature is the unprecedented minimum trading volume starting from just 0.001 lots, ensuring that you can engage with the market at your own pace and comfort level.
Why Choose Solid-Micro Account?
Accessibility for All: With a minimum deposit of just $5, stepping into the world of Forex trading has never been easier. This feature democratizes trading, making it accessible to everyone, regardless of their initial investment capacity.
Micro Lot Trading: Our innovative approach allows trading volumes to start from as little as 0.001 lots (100 units), providing unparalleled flexibility. This unique feature is especially advantageous for beginners looking to dip their toes into the market without significant risk, as well as for professionals seeking to test and refine their trading strategies or Expert Advisors in real-market conditions.
Enhanced Leverage: Experience the power of maximized potential with leverage up to 1:1000. This high leverage ratio amplifies your trading capabilities, enabling you to open larger positions and maximize your trading potential, all while maintaining control over your investment.
Empower Your Trading Journey
The Solid-Micro Account bridges the gap between aspiration and reality, offering a platform where both new and experienced traders can explore, innovate, and grow. Whether you're experimenting with new strategies, testing expert advisors, or simply taking your first steps in Forex, the Solid-Micro Account is tailored to meet your needs.
Start Today: Your Market Awaits
Embrace the opportunity to transform your trading with just a $5 start. The Solid-Micro Account is not just an account; it's a gateway to the vast possibilities of the Forex market. Feel free to open your account today and embark on a trading journey that promises flexibility, opportunity, and growth.Though trading on financial markets involves high risk, it can still generate extra income in case you apply the right approach. By choosing a reliable broker such as InstaForex you get access to the international financial markets and open your way towards financial independence. You can sign up here.
-
The Following User Says Thank You to Solid ECN For This Useful Post:
Unregistered (1)
-
Senior Member
- Join Date
- Oct 2022
- Posts
- 1,166
- Thanks
- 1
- Thanked 1,564 Times in 522 Posts
GBPJPY Navigates Bullish Patterns Amid Mixed Signals
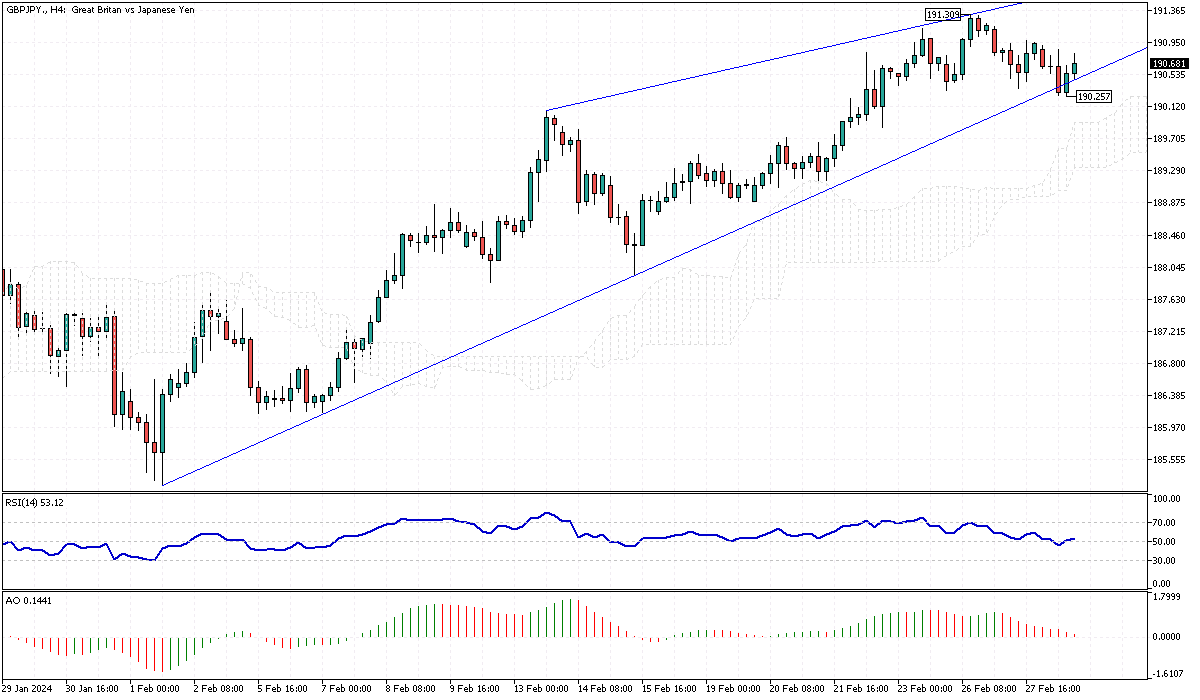
Solid ECN – The GBPJPY currency pair recently declined from the upper line of its bullish wedge pattern at the 191.0 mark. Subsequently, the pair tested the lower band and bounced back from 190.2, and it currently trades around 190.6.
The primary trend remains bullish, but the technical indicators provide mixed signals. On one hand, the RSI indicator suggests continuing the bull market. On the other hand, the Awesome Oscillator bars have turned red and are approaching the signal line, indicating potential caution. Based on the primary GBPJPY trend, we can predict that the uptick momentum will likely resume if the pair maintains its position within the wedge's boundaries.
Even if the price dips below the 190.2 level, considered a resistance point, the Ichimoku cloud emerges as the next significant barrier for the sellers.
From a technical standpoint, as long as the price remains above the cloud, our technical analysis remains unchanged. This situation suggests a potential for continued bullish behavior, securing any significant market shifts.Though trading on financial markets involves high risk, it can still generate extra income in case you apply the right approach. By choosing a reliable broker such as InstaForex you get access to the international financial markets and open your way towards financial independence. You can sign up here.
-
Senior Member
- Join Date
- Oct 2022
- Posts
- 1,166
- Thanks
- 1
- Thanked 1,564 Times in 522 Posts
USDJPY Bullish Trend: Key Resistance and Potential Invalidations
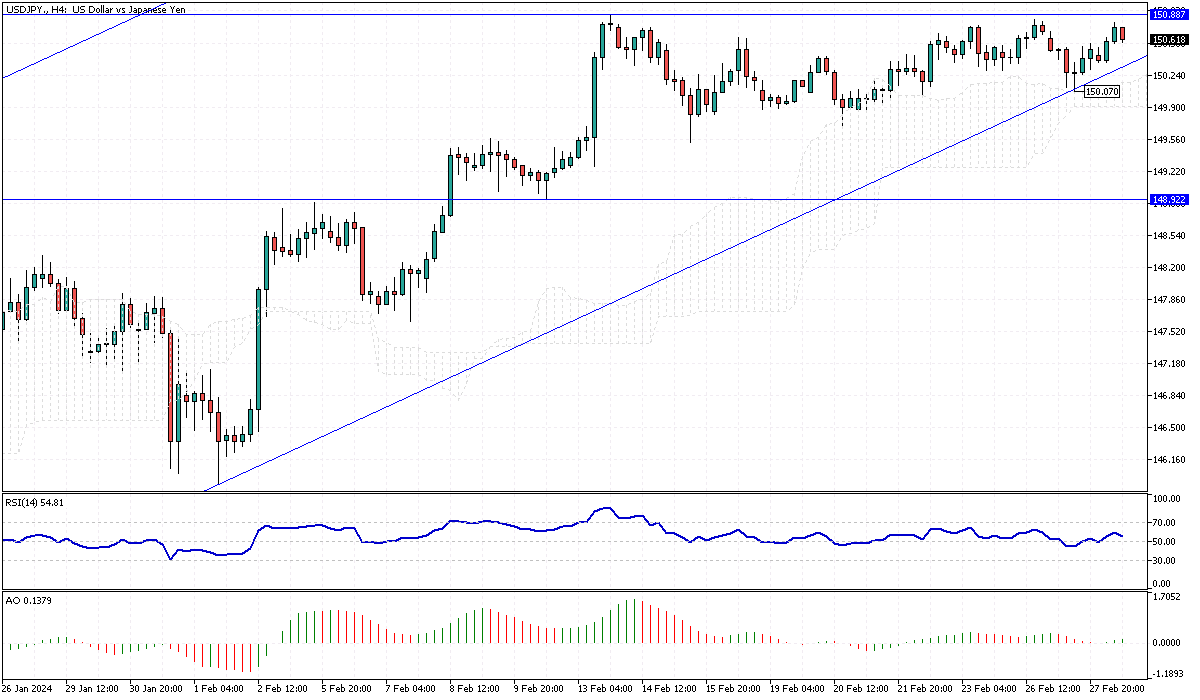
Solid ECN – As expected, the USDJPY price rose from the 150.0 mark, maintaining a bullish trend due to this support from the Ichimoku cloud and the bullish channel. For the pair to continue its growth, the bulls must break above the 150.88 resistance.
Conversely, the bull market could be invalidated if the price dips below the cloud, specifically below the 150.0 mark.Though trading on financial markets involves high risk, it can still generate extra income in case you apply the right approach. By choosing a reliable broker such as InstaForex you get access to the international financial markets and open your way towards financial independence. You can sign up here.
-
Senior Member
- Join Date
- Oct 2022
- Posts
- 1,166
- Thanks
- 1
- Thanked 1,564 Times in 522 Posts
U.S. Dollar Leads in Today's Market Against GBP
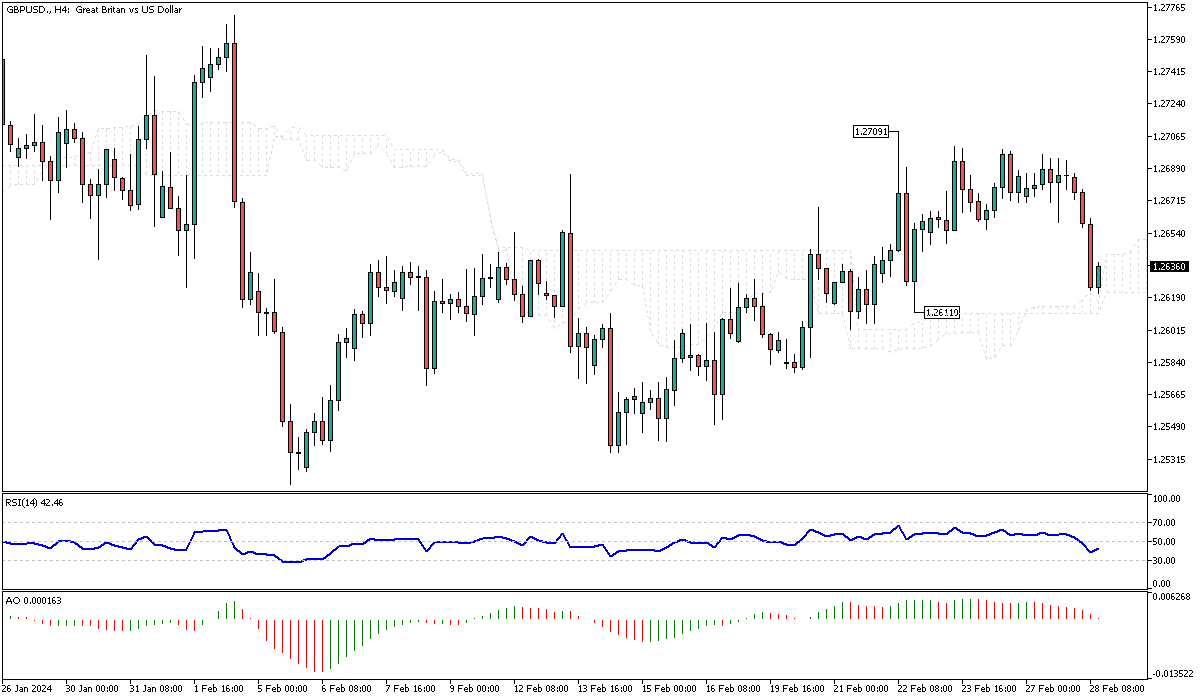
Solid ECN – The U.S. Dollar is leading in today's trading against the pound sterling, with the GBPUSD pair trading around 1.263. The Ichimoku cloud supports this price area. From a technical standpoint, for the downtrend to continue, bears must stabilize the price below this level. Although technical indicators support a bearish scenario, there is still a chance for the bulls to take control, especially if the 1.2611 level holds firm.
In conclusion, the price must fall below the cloud for the bear market to extend further. Otherwise, we will likely witness the GBPUSD pair rise again, aiming for the 1.2709 resistance level.Though trading on financial markets involves high risk, it can still generate extra income in case you apply the right approach. By choosing a reliable broker such as InstaForex you get access to the international financial markets and open your way towards financial independence. You can sign up here.
-
Senior Member
- Join Date
- Oct 2022
- Posts
- 1,166
- Thanks
- 1
- Thanked 1,564 Times in 522 Posts
EURUSD Analysis: Bearish Trend is Likely To continue
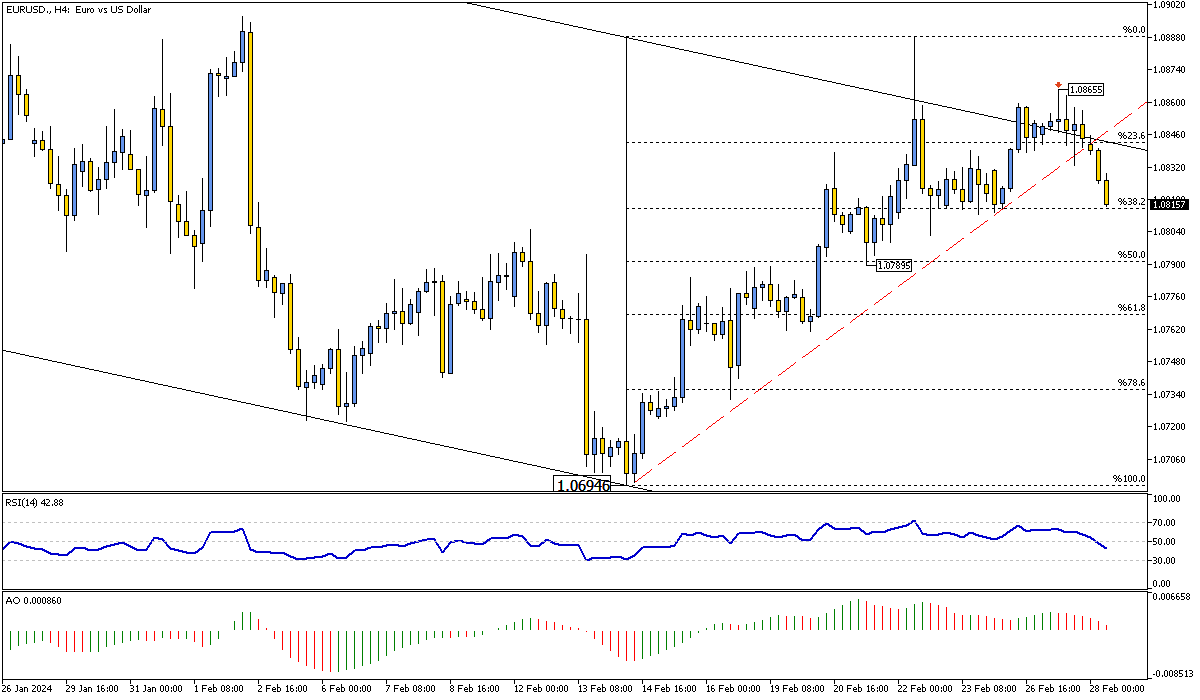
The Euro trades around 1.082 against the U.S. Dollar in Wednesday's trading session, stabilizing itself below the broken ascending trendline, as illustrated in the 4-hour chart. This breakout could be interpreted as either a temporary or long-term shift in market direction, transitioning from a bull to a bear market.
Furthermore, as the EURUSD tests the 38.2% Fibonacci support level, technical indicators suggest that the decline, which began from the 1.0865 higher low, is likely to continue.
Therefore, from a technical standpoint, with the price maintaining its position within the bearish flag, depicted in black lines, the bear market is expected to extend and potentially test the 50% Fibonacci support, followed by the 61.8% level.
Conversely, the 1.0866 level acts as resistance. The bearish outlook should be invalidated if the EURUSD price crosses above this level.Though trading on financial markets involves high risk, it can still generate extra income in case you apply the right approach. By choosing a reliable broker such as InstaForex you get access to the international financial markets and open your way towards financial independence. You can sign up here.
-
Senior Member
- Join Date
- Oct 2022
- Posts
- 1,166
- Thanks
- 1
- Thanked 1,564 Times in 522 Posts
Experience Seamless Trading with Solid ECN MT 5 Web-Trader!
Exciting news from Solid ECN – our MetaTrader 5 Web-Trader platform is here to elevate your trading experience! Designed to cater to your dynamic lifestyle and trading preferences, our web platform ensures you're never more than a couple of clicks away from the global Forex, exchange, and futures markets.
Why Choose Solid ECN MetaTrader 5 Web-Trader?
- Universal Access: Trade from any browser and operating system (Windows, Mac, Linux) without the hassle of downloads or installations. Your trading environment follows you wherever you go.
- Full-Featured Trading: Enjoy the same extensive functionalities as the MetaTrader 5 desktop platform, including advanced charting tools, robust financial quotes analysis, and one-click trading.
- Secure and Safe: Rest assured, trading on our web platform is encrypted and secure, ensuring the safety of your trading information and transactions.
- Instant Market Access: With Solid ECN, begin trading in moments. Our platform is designed for efficiency and ease, allowing you to focus on what matters – making the most of market opportunities.
Exclusive Benefits for Solid ECN Traders:
- Start with More: Open a free account today and enjoy up to a %40 deposit bonus to maximize your trading potential.
- Empower Your Trades: Leverage up to 1:1000, giving you the power to amplify your trading strategies.
- Speed and Reliability: Benefit from ultra-fast execution to maximize market movements.
- Risk Management: Trade confidently, knowing you have negative balance protection and a solid refund policy backing your investments.
Join the Solid ECN family and transform your trading journey with the MetaTrader 5 Web-Trader. Embrace the future of trading with a platform that's intuitive, powerful, and designed with your success in mind.
https://solidecn.com >>> %15 Bonus | Swap Free | Raw Spread | RegulatedThough trading on financial markets involves high risk, it can still generate extra income in case you apply the right approach. By choosing a reliable broker such as InstaForex you get access to the international financial markets and open your way towards financial independence. You can sign up here.
-
Senior Member
- Join Date
- Oct 2022
- Posts
- 1,166
- Thanks
- 1
- Thanked 1,564 Times in 522 Posts
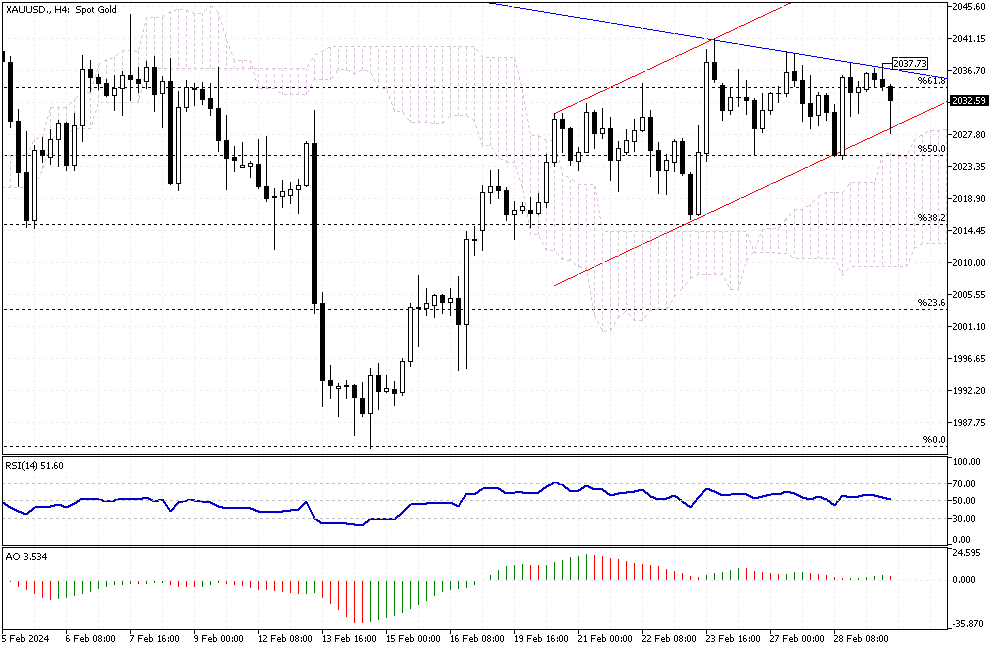
Gold Analysis: Bearish Signals Emerge Amid Technical Indicators
Solid ECN – The price of gold has fallen to \$2,030 against the U.S. dollar, reaching the lower band of the bullish flag, depicted in red. The Awesome Oscillator indicator shows signs of divergence, suggesting that the bears attempt to cross below the \$2,028 threshold. Adding to this bearish sentiment, the Relative Strength Index (RSI) indicator is closing below the median line, lending credibility to the recent XAU/USD price decline.
From a technical perspective, for the bull market to continue, the price of gold needs to stabilize above the 61.8% Fibonacci retracement level, a task that it failed to achieve this week.
On the flip side, if the price crosses the bullish flag and maintains a position below the \$2,039 resistance level, the decline will likely extend its reach to the Ichimoku cloud, a resistance level further powered by the 50% Fibonacci level.Though trading on financial markets involves high risk, it can still generate extra income in case you apply the right approach. By choosing a reliable broker such as InstaForex you get access to the international financial markets and open your way towards financial independence. You can sign up here.
Results 111 to 120 of 1182

 Reply With Quote