 Thread:


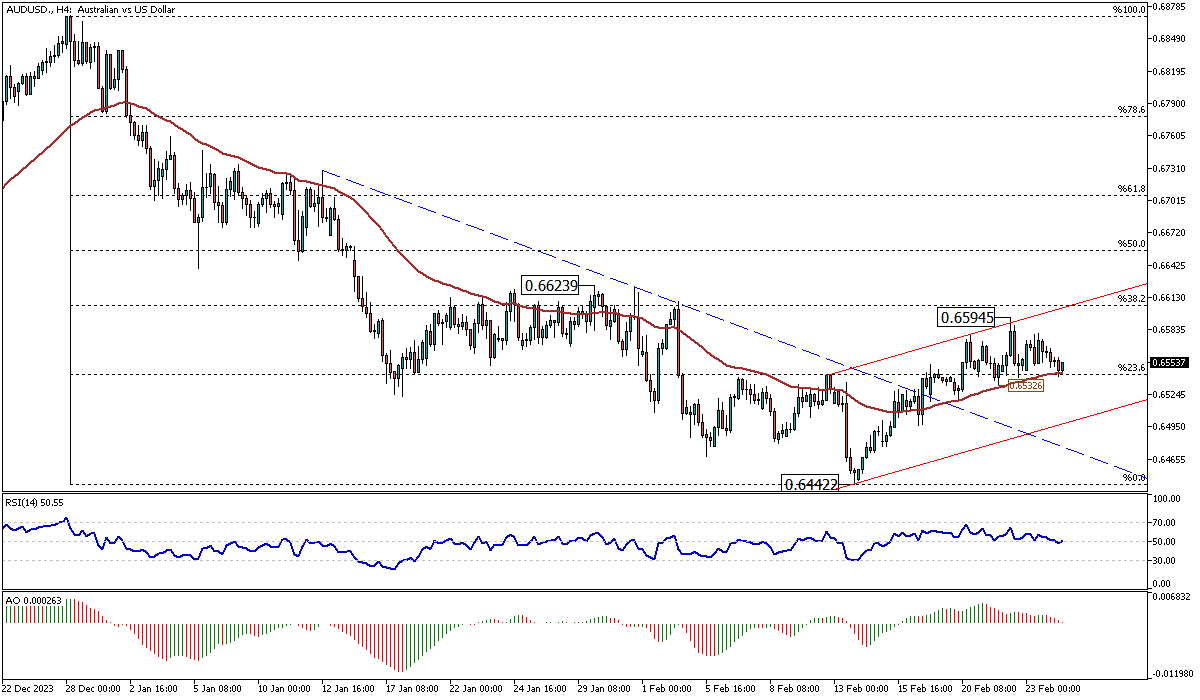
AUDUSD Trading Analysis: Clinging to Fibonacci Support and 50 EMA
Solid ECN – In today's trading sessions, the Australian dollar trades around 0.655 against the U.S. Dollar, clinging to the 23.6% Fibonacci support and the 50 EMA. However, other technical indicators are providing a bearish signal. The RSI indicator has crossed below the median line, and the bars of the awesome oscillator have turned red and are about to flip below the signal line.
From a technical standpoint, the 0.6532 level supports the bullish momentum, which broke out from the descending trendline, depicted in blue on the AUDUSD 4-hour chart. If the price stays above this level, the 38.2% Fibonacci support could still be the target. This resistance level is further supported by the upper line of the bullish flag, depicted in red on the chart.
Despite these factors, the bullish scenario seems weak for this pair. This can be figured from the candlesticks, where the number of full-bodied bear candles exceeds the bull candles.
Conversely, if the AUDUSD price falls below the 50 EMA, the decline from 0.6594 could lead to the bottom of the bullish flag. This scenario is more likely to play out.
Therefore, traders should monitor the 50 exponential moving average closely.
Malaysia Forex Forum
- Forum
- Forex Charts
- Monitoring
- Forex TV

-
Senior Member


- Join Date
- Oct 2022
- Posts
- 1,171
- Thanks
- 1
- Thanked 1,564 Times in 522 Posts
Though trading on financial markets involves high risk, it can still generate extra income in case you apply the right approach. By choosing a reliable broker such as InstaForex you get access to the international financial markets and open your way towards financial independence. You can sign up here.
-
Senior Member
- Join Date
- Oct 2022
- Posts
- 1,171
- Thanks
- 1
- Thanked 1,564 Times in 522 Posts
GBPUSD Bullish Trend Faces Slowdown
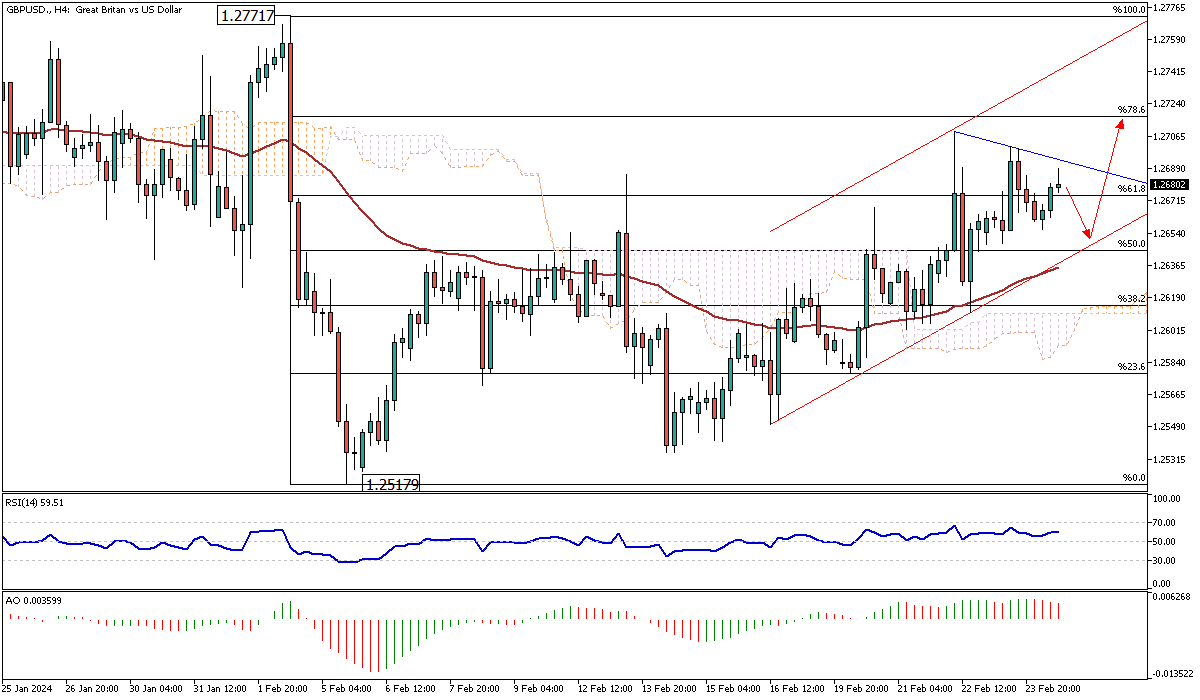
Solid ECN – The GBPUSD trades inside the bullish channel and above the 50 exponential moving average (EMA). This indicates that the primary trend is bullish. However, the awesome oscillator shows signs of a slowdown in the trend.
From a technical standpoint, the 50%Fibonacci retracement level supports the bull market, and the bottom line of the flag further supports this zone. Therefore, as long as the pair trades above it, the technical analysis for the GBPUSD predicts more upward momentum. In this case, the channel's upper band can be considered the next bullish target. It is worth noting that the price must exceed the declining trendline, depicted in blue, to reach the target.
Conversely, the above technical analysis would be invalidated if the price falls below %50 Fibonacci. If this scenario continues, traders should wait to see how the price reacts to the 50 EMA and the Ichimoku cloud support zone.Though trading on financial markets involves high risk, it can still generate extra income in case you apply the right approach. By choosing a reliable broker such as InstaForex you get access to the international financial markets and open your way towards financial independence. You can sign up here.
-
Senior Member
- Join Date
- Oct 2022
- Posts
- 1,171
- Thanks
- 1
- Thanked 1,564 Times in 522 Posts
Trade Easily with MetaTrader 5 Web - Solid ECN
The MetaTrader 5 online platform lets you trade Forex, stocks, and futures from any web browser and system, such as Windows, Mac, or Linux. Enjoy the full features of the MetaTrader 5 desktop version directly online without downloading or installing. Analyze market data and execute trades quickly. Log into your account and begin trading with just a few mouse clicks. Web-based trading on this platform is secure, with all transmitted data being fully encrypted.
Enjoy benefits like 1:1000 leverage, a 15% deposit bonus, rapid transaction speeds, protection against negative balances, and our refund policy.
https://solidecn.com
%15 Bonus | Swap Free | Raw Spread | RegulatedThough trading on financial markets involves high risk, it can still generate extra income in case you apply the right approach. By choosing a reliable broker such as InstaForex you get access to the international financial markets and open your way towards financial independence. You can sign up here.
-
Senior Member
- Join Date
- Oct 2022
- Posts
- 1,171
- Thanks
- 1
- Thanked 1,564 Times in 522 Posts
Bitcoin's Uptrend Amid Range-Bound Trading and EMA Support
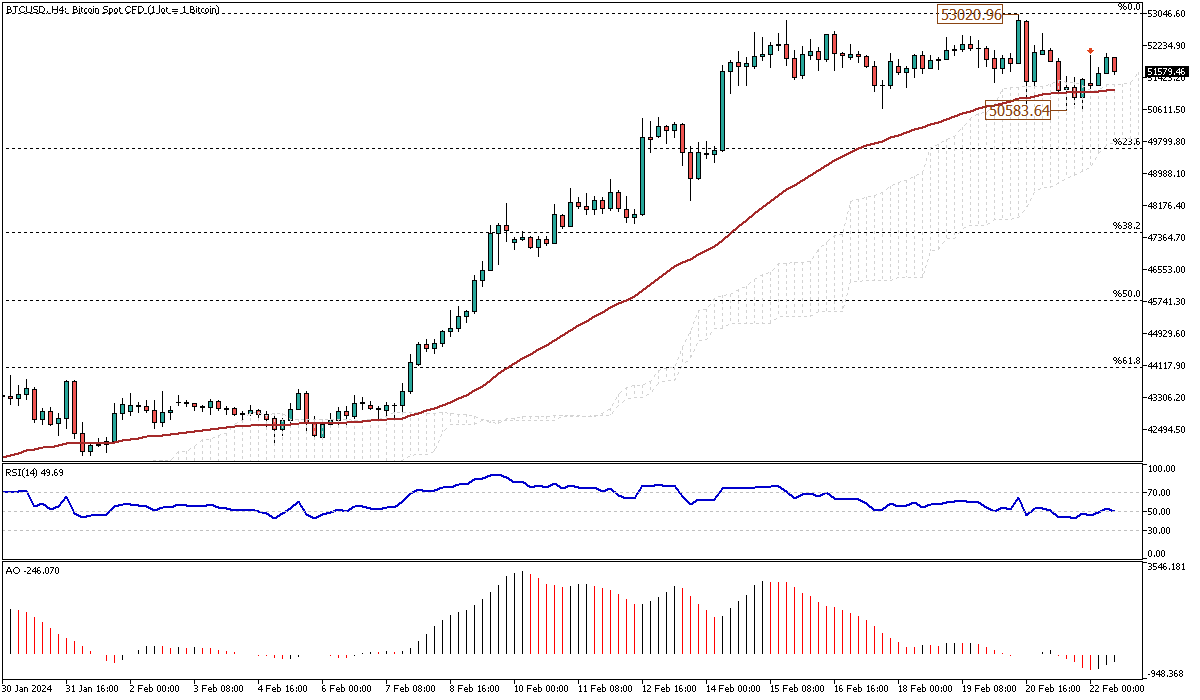
Solid ECN – Bitcoin has been between $50,000 and $53,000 and has stayed above the 50 EMA, as shown in the 4-hour chart. When writing, the BTCUSD is trading around $51,600, with the technical indicators promising a continuation of the uptrend.
The RSI indicator flips above 50, and the AO bars have turned green.
The $50,583 level serves as the support to the primary bullish trend. Therefore, from a technical standpoint, if this minor support holds, the uptrend will likely continue, with $53,020 as its first target, followed by the psychological resistance level at $55,000.
On the flip side, if the BTCUSD price falls below the 50 EMA, the 23.6% Fibonacci retracement level will be the first barrier for the bears to confront. This level is further backed up by the Ichimoku cloud, which makes it an exciting price area for the bulls to add new bids.Though trading on financial markets involves high risk, it can still generate extra income in case you apply the right approach. By choosing a reliable broker such as InstaForex you get access to the international financial markets and open your way towards financial independence. You can sign up here.
-
Senior Member
- Join Date
- Oct 2022
- Posts
- 1,171
- Thanks
- 1
- Thanked 1,564 Times in 522 Posts
Pound Rises Against Dollar, Eyes Key Levels
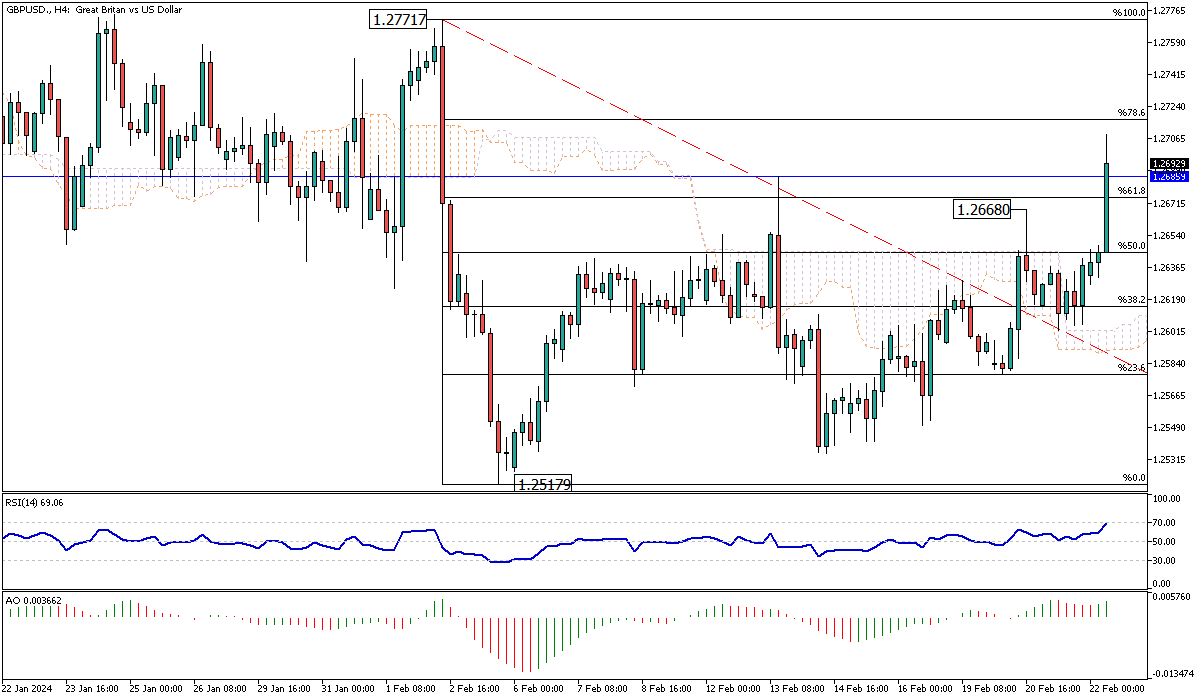
Solid ECN – The British pound is on an upward trajectory against the U.S. Dollar, with the exchange rate hovering around 1.2600. The Relative Strength Index (RSI) is poised to enter the overbought zone, suggesting that the pair might soon test the 61.8% Fibonacci retracement level before potentially launching on another bullish wave.
Furthermore, the 61.8% level, or the 1.2668 support, presents a favorable opportunity for traders to place bids in the GBPUSD bullish market. Should the 61.8% level hold, the next target for buyers could be the February high, around the 1.277 resistance mark.
Conversely, a failure to maintain levels above 1.2668 could result in the price descending to test the 50% Fibonacci support. This shift would signify a notable change in market sentiment, potentially leading to reevaluating the current bullish trend.Though trading on financial markets involves high risk, it can still generate extra income in case you apply the right approach. By choosing a reliable broker such as InstaForex you get access to the international financial markets and open your way towards financial independence. You can sign up here.
-
Senior Member
- Join Date
- Oct 2022
- Posts
- 1,171
- Thanks
- 1
- Thanked 1,564 Times in 522 Posts
Euro’s Struggle Against the U.S. Dollar Amid Fibonacci Resistance
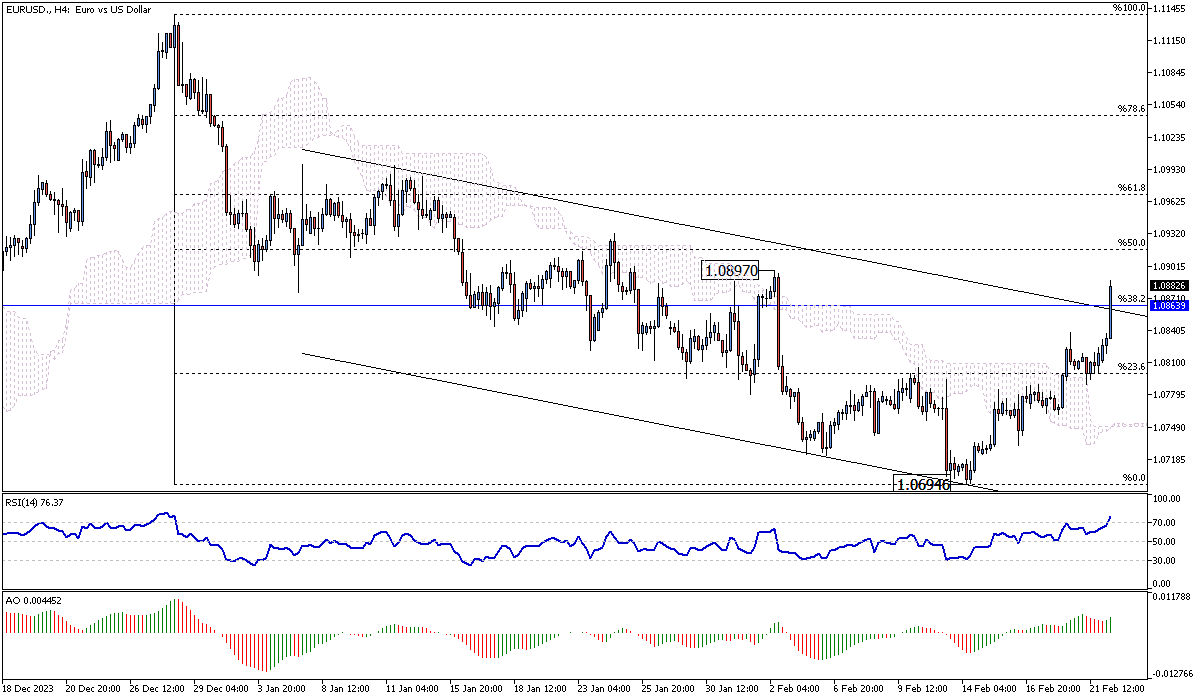
Solid ECN – The Euro is trading above the 38.2% Fibonacci resistance against the U.S. Dollar, which stands at 1.085. This level is clinging to the upper band of the bearish flag. Interestingly, the RSI indicator has stepped into the overbought zone. This could be interpreted as a sign that the uptick in momentum, which began on February 12, might ease near this level.
From a technical standpoint, the primary trend is bearish. However, this could be invalidated if the bulls manage to cross and stabilize the price above the 1.08639 ceiling.
On the other hand, if the 1.08639 level holds, the EURUSD pair will likely turn downward again. In this scenario, the 23.6% Fibonacci support would be tested once more.
Happy trading!Though trading on financial markets involves high risk, it can still generate extra income in case you apply the right approach. By choosing a reliable broker such as InstaForex you get access to the international financial markets and open your way towards financial independence. You can sign up here.
-
Senior Member
- Join Date
- Oct 2022
- Posts
- 1,171
- Thanks
- 1
- Thanked 1,564 Times in 522 Posts
U.S. Dollar Index Tests Fibonacci Support: A Technical Analysis
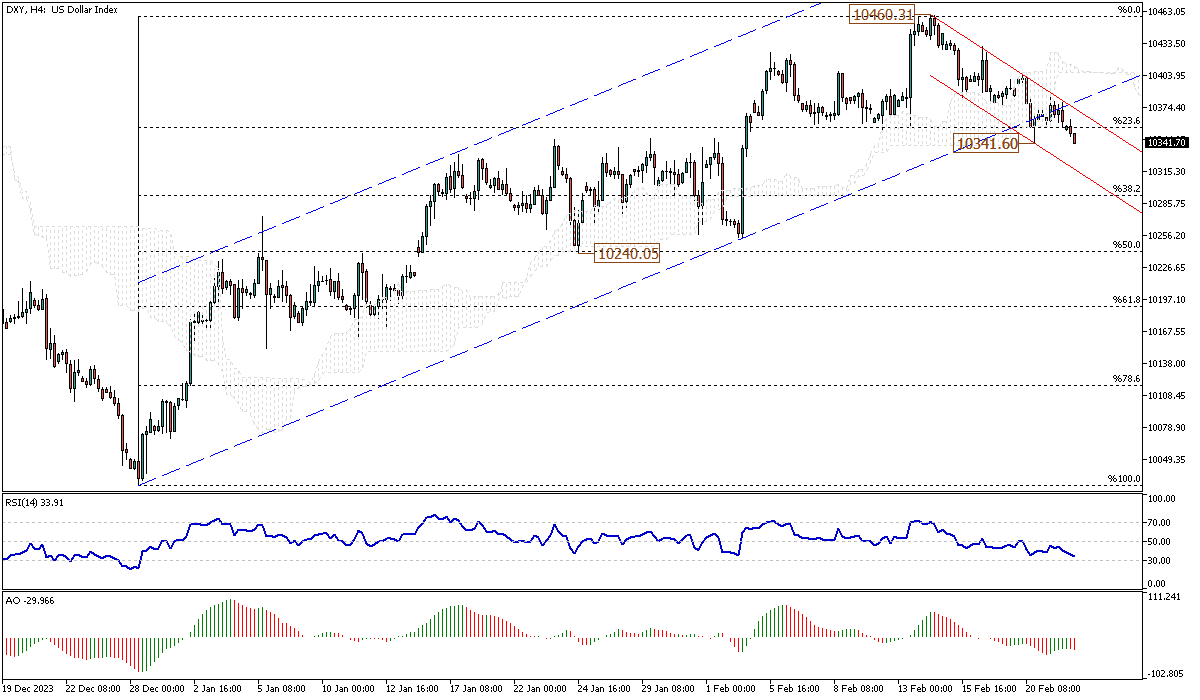
Solid ECN – The U.S. Dollar index is testing the $10,341 mark, below the 23.6% Fibonacci support level. Subsequently, the DXY index is experiencing a decline within the bearish flag following its breakdown from the bullish channel, as depicted in the 4-hour chart. The technical indicators also show similar patterns in alignment with this new trend. Specifically, the RSI indicator is floating below 50, and the bars of the awesome oscillator are in red.
Therefore, from a technical standpoint, the trend is downward as long as the index trades below the Ichimoku cloud. If the bears maintain their positions, the next target could be the 38.2% Fibonacci support level, followed by the $10,240 mark.
On the flip side, if the bulls push the price above the Ichimoku cloud, the bearish scenario mentioned earlier would be invalidated. In such a scenario, the index would likely test the February 14th higher high at the $10,460 mark.
Happy trading!Though trading on financial markets involves high risk, it can still generate extra income in case you apply the right approach. By choosing a reliable broker such as InstaForex you get access to the international financial markets and open your way towards financial independence. You can sign up here.
-
Senior Member
- Join Date
- Oct 2022
- Posts
- 1,171
- Thanks
- 1
- Thanked 1,564 Times in 522 Posts
USDCAD Price Analysis: Testing 23.6% Fibonacci Resistance
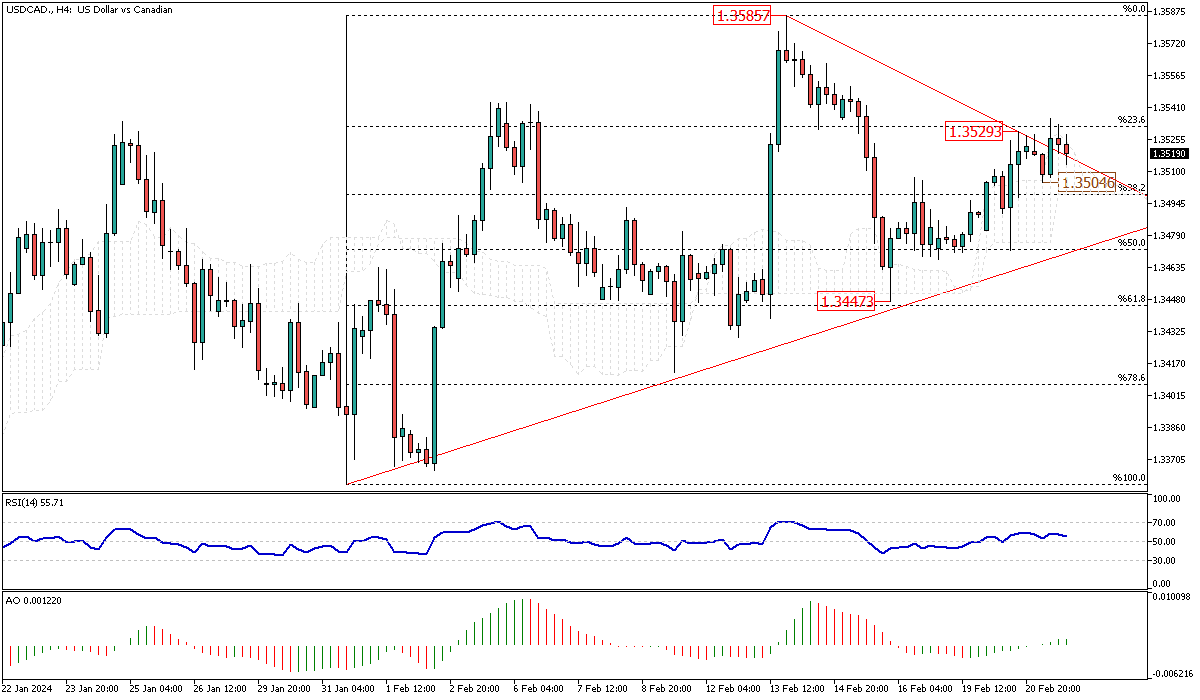
When writing, the USDCAD price is 1.352, slightly below the 23.6% Fibonacci resistance currently under test. The technical indicators are bullish, with the RSI floating above 50, and the AO bars are green beyond the signal line.
From a technical standpoint, the bulls must break the 1.3529 resistance for the primary uptrend to continue. If this scenario unfolds, the next bullish target will be the February higher high at 1.3585.
On the flip side, if the USDCAD price falls below the 1.3504 mark, the decline would extend to the 50% Fibonacci resistance. This is where the ascending trendline supports the trend. It’s worth noting that as long as this trendline remains unbroken, the primary USDCAD trend should be considered bullish.Though trading on financial markets involves high risk, it can still generate extra income in case you apply the right approach. By choosing a reliable broker such as InstaForex you get access to the international financial markets and open your way towards financial independence. You can sign up here.
-
Senior Member
- Join Date
- Oct 2022
- Posts
- 1,171
- Thanks
- 1
- Thanked 1,564 Times in 522 Posts
USDJPY Trades in Ascending Channel Amid Bullish Indications

Solid ECN – The USDJPY pair trades within an ascending channel, indicating that traders should seek extended opportunities rather than short ones. However, the price has been fluctuating within a bearish flag, depicted in red, since February 13th. Meanwhile, the technical indicators don't provide valuable data on the next market move. The RSI indicator is clinging to the middle line, while the AO bars are small, with a slight increase in the green bars.
From a technical standpoint, the lower band of the bullish flag, depicted in blue, serves as support for the primary trend, which is bullish. As long as the USDJPY price remains within the flag, the ultimate forecast is an increase in the value of the U.S. dollar against the Japanese yen. In this scenario, the bulls must close above the 159.4 resistance for the uptrend to resume. Otherwise, the weak bearish momentum seen on the chart might extend to the lower band of the flag. It's worth noting that the 148.9 resistance area offers a better entry point than the current market value, which is 150 at the time of writing.Though trading on financial markets involves high risk, it can still generate extra income in case you apply the right approach. By choosing a reliable broker such as InstaForex you get access to the international financial markets and open your way towards financial independence. You can sign up here.
-
Senior Member
- Join Date
- Oct 2022
- Posts
- 1,171
- Thanks
- 1
- Thanked 1,564 Times in 522 Posts
USDCAD Tests Fibonacci Resistance Amid Bullish Wave

Solid ECN – The USDCAD pair is testing the 23.6% Fibonacci resistance at the 1.3529 mark, following the bullish wave that began on February 15th from the 1.3447 mark, the 61.8% Fibonacci support level. The 4-hour chart shows that the bulls have crossed above the bearish trendline with a long-bodied candlestick. This could be interpreted as a continuation of the uptrend momentum. Interestingly, the technical indicators back up this momentum, with the relative strength index pointing upwards and the awesome oscillator flipping above the signal line.
From a technical standpoint, the U.S. dollar is likely to gain more against the Canadian dollar, and the next target for the buyers could be the 1.3585 resistance.
On the flip side, the bullish trendline is the primary support for the uptrend. The uptrend scenario outlined above should be invalidated if the price falls below this level corresponding to the 50% Fibonacci level or the 1.3471 mark.Though trading on financial markets involves high risk, it can still generate extra income in case you apply the right approach. By choosing a reliable broker such as InstaForex you get access to the international financial markets and open your way towards financial independence. You can sign up here.
Results 131 to 140 of 1187

 Reply With Quote