 Thread:


USD/CHF Consolidation Could Target 50 SMA
Solid ECN—The USD/CHF currency pair trades below the 50-period simple moving average and the descending trendline, indicating that the primary trend is bearish. However, the technical indicators suggest the bull market is losing momentum, and the price could increase to test the $0.891 resistance. If this scenario unfolds, the $0.891 demand area can provide a decent entry point to join the bear market.
Therefore, traders and investors should closely monitor $0.891 and the 50-period SMA for bearish signals, such as a bearish engulfing candlestick pattern.
Furthermore, if the buying pressure exceeds the descending trendline, the bear market should be invalidated, and the USD/CHF next resistance will be the $0.897 mark.
Malaysia Forex Forum
- Forum
- Forex Charts
- Monitoring
- Forex TV

-
Senior Member


- Join Date
- Oct 2022
- Posts
- 1,307
- Thanks
- 1
- Thanked 1,838 Times in 602 Posts
Though trading on financial markets involves high risk, it can still generate extra income in case you apply the right approach. By choosing a reliable broker such as InstaForex you get access to the international financial markets and open your way towards financial independence. You can sign up here.
-
Senior Member
- Join Date
- Oct 2022
- Posts
- 1,307
- Thanks
- 1
- Thanked 1,838 Times in 602 Posts
USD/JPY Nears Symmetrical Triangle Apex
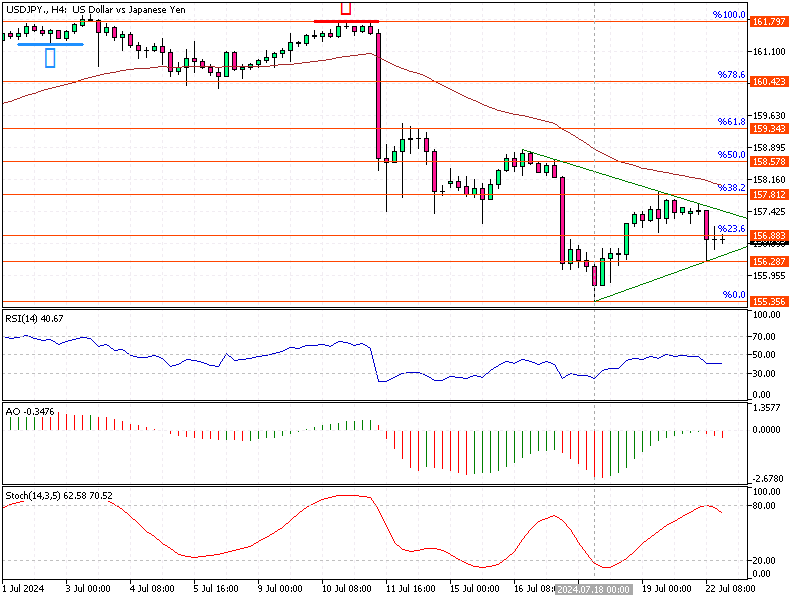
Solid ECN—The USD/JPY currency pair trades at approximately 157.8 in today's trading session, approaching the apex of the symmetrical triangle. The primary trend is bearish because the price is below the 50-period simple moving average. Other technical indicators suggest the downtrend should resume.
If the price dips below the ascending trendline and the 156.28 immediate support, the July 18 low at 155.35 will likely be tested. Furthermore, if the selling pressure exceeds 155.35, the next supply zone will be 154.4.
Conversely, the bearish outlook should be invalidated if the USD/JPY price crosses above the 38.2% Fibonacci at 157.8, a level backed by the 50 SMA.Though trading on financial markets involves high risk, it can still generate extra income in case you apply the right approach. By choosing a reliable broker such as InstaForex you get access to the international financial markets and open your way towards financial independence. You can sign up here.
-
Senior Member
- Join Date
- Oct 2022
- Posts
- 1,307
- Thanks
- 1
- Thanked 1,838 Times in 602 Posts
AUD/USD Oversold Signals Suggest Rebound

Solid ECN—The RSI 14 and the Stochastic oscillator signal that the AUD/USD currency pair is oversold. Despite the bearish trend, we expect the price to bounce from the 0.665 support area. If this scenario comes into play, the price will likely test the upper line of the bearish flag, which coincides with the 61.8% Fibonacci level. The $0.668 level offers retail traders a decent ask price to join the bear market.
Please note that the bear market should be invalidated if the AUD/USD price stabilizes above the 50% Fibonacci.Though trading on financial markets involves high risk, it can still generate extra income in case you apply the right approach. By choosing a reliable broker such as InstaForex you get access to the international financial markets and open your way towards financial independence. You can sign up here.
-
Senior Member
- Join Date
- Oct 2022
- Posts
- 1,307
- Thanks
- 1
- Thanked 1,838 Times in 602 Posts
EUR/USD Analysis: Uptrend and Resistance Insights
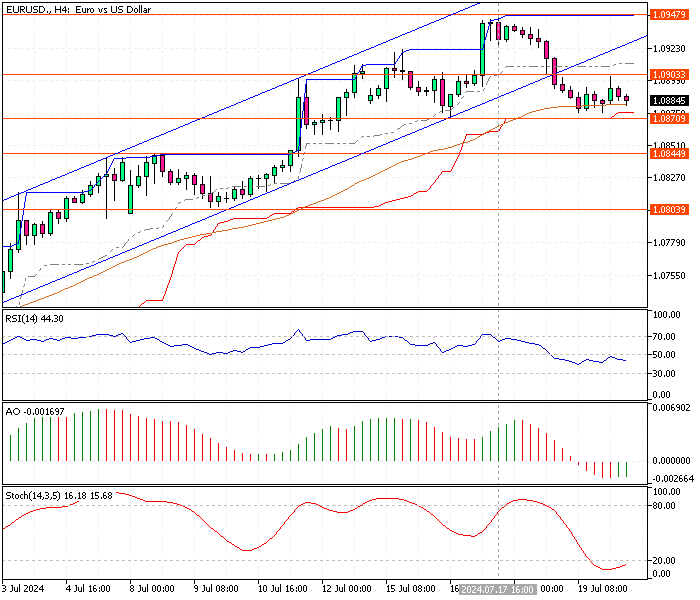
Solid ECN—The EUR/USD currency pair tests the 50-period simple moving average and the 1.0870 immediate support. The technical indicators in the 4-hour chart suggest the primary trend is bullish. However, the pair might be oversold because the Stochastic oscillator hovers below the 20 line.
The immediate resistance is at 1.090. The uptrend will likely resume if the bulls close a candle and stabilize the price above the immediate resistance. In this scenario, the next bullish target will be the July 17 high at 1.094.
Conversely, if the bears close below the immediate support at 1.084, the consolidation phase from 1.094 could extend to the next supply area at 1.0844.Though trading on financial markets involves high risk, it can still generate extra income in case you apply the right approach. By choosing a reliable broker such as InstaForex you get access to the international financial markets and open your way towards financial independence. You can sign up here.
-
Senior Member
- Join Date
- Oct 2022
- Posts
- 1,307
- Thanks
- 1
- Thanked 1,838 Times in 602 Posts
Bullish Continuation in USD/JPY?

Solid ECN—The USD/JPY bounced from the 155.3 mark, testing the 38.2% Fibonacci at 157.8. The technical indicators suggest the bull market should resume. However, for the uptrend to continue, the bulls must overcome the 157.8 barrier. If this scenario unfolds, the pullback from 155.35 could extend to the 50% Fibonacci at 158.5. Furthermore, if the buying pressure exceeds 158.5, the next resistance will be at the 61.8% Fibonacci mark, 159.3.
Conversely, a dip below the immediate support at 156.8 will end the bullish trend, and sellers could target July's all-time low.Though trading on financial markets involves high risk, it can still generate extra income in case you apply the right approach. By choosing a reliable broker such as InstaForex you get access to the international financial markets and open your way towards financial independence. You can sign up here.
-
Senior Member
- Join Date
- Oct 2022
- Posts
- 1,307
- Thanks
- 1
- Thanked 1,838 Times in 602 Posts
Ethereum's Critical Levels: $3,390 Support, $3,528 Resistance

Solid ECN—Ethereum trades sideways between the immediate support at $3,390 and the immediate resistance at $3,528. As of writing, the ETH/USD pair is testing the 50% Fibonacci level, backed by the ascending trendline.
The technical indicators suggest the sideways market might resume with mildly bearish tendencies. Interestingly, the 4-hour chart has formed an inverted hammer, signaling a potential trend reversal. That said, if the ETH/USD price closes above the median line of the Donchian channel, the next bullish target will be July's all-time high at $3,528.
Conversely, a close below the immediate support at $3,390 will likely pause the bull market, and the price could dip to the 38.2% Fibonacci level at $3,253.Though trading on financial markets involves high risk, it can still generate extra income in case you apply the right approach. By choosing a reliable broker such as InstaForex you get access to the international financial markets and open your way towards financial independence. You can sign up here.
-
Senior Member
- Join Date
- Oct 2022
- Posts
- 1,307
- Thanks
- 1
- Thanked 1,838 Times in 602 Posts
EUR/USD Analysis: Key Resistance at 1.087

Solid ECN—The EUR/USD currency pair dipped below the ascending trendline, approaching the key resistance level at 1.087. The technical indicators in the 4-hour chart suggest that the bearish momentum will likely extend to the lower resistance zones.
The immediate resistance that could keep the price from dipping further is 1.087. If this level holds, the uptrend will likely resume. However, if the bears push the price below 1.087, the consolidation phase could extend to 1.084.
Therefore, traders and investors should closely monitor the 1.087 key resistance level for bullish candlestick patterns or a bearish breakout to plan their strategies accordingly.Though trading on financial markets involves high risk, it can still generate extra income in case you apply the right approach. By choosing a reliable broker such as InstaForex you get access to the international financial markets and open your way towards financial independence. You can sign up here.
-
Senior Member
- Join Date
- Oct 2022
- Posts
- 1,307
- Thanks
- 1
- Thanked 1,838 Times in 602 Posts
Silver's Bearish Trend: Key Levels to Watch

Solid ECN—Silver's short-term trend direction is bearish, trading in a bearish flag, slightly above the 100-period simple moving average. The XAG/USD pair is testing the 38.2% Fibonacci at $30.5 in the current session, with technical indicators suggesting the downtrend should resume.
The immediate resistance is at $30.5. The downtrend will likely resume if the price remains below this barrier. In this scenario, the sellers could initially target the lower line of the bearish flag.
On the flip side, if the bulls (buyers) close and stabilize the price above the immediate resistance, the pullback that began from the 50% Fibonacci could result in the Silver price surging and targeting the 23.6% Fibonacci at $30.9.Though trading on financial markets involves high risk, it can still generate extra income in case you apply the right approach. By choosing a reliable broker such as InstaForex you get access to the international financial markets and open your way towards financial independence. You can sign up here.
-
Senior Member
- Join Date
- Oct 2022
- Posts
- 1,307
- Thanks
- 1
- Thanked 1,838 Times in 602 Posts
USD/CAD Tests Key Trendline at 1.367

Solid ECN—The USD/CAD currency pair tests the ascending trendline at approximately 1.367, with the technical indicators in the 4-hour chart suggesting the bearish momentum might extend to the lower resistance level.
The primary trend is bullish, with the price above the 38.2% Fibonacci level. If the USD/CAD price holds above the 1.366 mark, the uptrend will likely resume to retest the 1.370.
Conversely, if the price dips below 1.366, the bullish outlook will be invalidated. In this scenario, the next support level will be at the 50% Fibonacci retracement level at 1.364.Though trading on financial markets involves high risk, it can still generate extra income in case you apply the right approach. By choosing a reliable broker such as InstaForex you get access to the international financial markets and open your way towards financial independence. You can sign up here.
-
Senior Member
- Join Date
- Oct 2022
- Posts
- 1,307
- Thanks
- 1
- Thanked 1,838 Times in 602 Posts
Bearish Momentum in EUR/USD Gains Strength

Solid ECN—The EUR/USD currency pair is in an overbought state, trading at about 1.093 and testing the immediate resistance at 1.0922. The stochastic oscillator is above 80 and declining, indicating that bearish momentum is gaining strength.
It is likely for the bears to dip the price to test the ascending trendline before the uptrend resumes. If the price dips below the trendline, the next support level will be 1.0870.Though trading on financial markets involves high risk, it can still generate extra income in case you apply the right approach. By choosing a reliable broker such as InstaForex you get access to the international financial markets and open your way towards financial independence. You can sign up here.
Results 11 to 20 of 1323


 Reply With Quote