 Thread:


In vino veritas
Malaysia Forex Forum
- Forum
- Forex Charts
- Monitoring
- Forex TV

-
Banned


- Join Date
- Jul 2024
- Posts
- 695
- Thanks
- 0
- Thanked 8,649 Times in 432 Posts


Cornu copiae
Though trading on financial markets involves high risk, it can still generate extra income in case you apply the right approach. By choosing a reliable broker such as InstaForex you get access to the international financial markets and open your way towards financial independence. You can sign up here.
-
The Following 12 Users Say Thank You to aadmindebugdebug For This Useful Post:
Unregistered (12)
-
Senior Member
- Join Date
- Oct 2022
- Posts
- 1,334
- Thanks
- 1
- Thanked 2,413 Times in 751 Posts
AUD/USD Hits Near One-Week High Amid RBA and Fed Speculations

Solid ECN—The Australian dollar climbed to around $0.655, reaching a nearly one-week high as investors assessed the latest monetary policy decisions from the Reserve Bank of Australia. The currency also gained from expectations that the US Federal Reserve might lower interest rates more aggressively soon.
On Tuesday, the RBA kept the cash rate at 4.35% for the sixth consecutive meeting, which was widely anticipated. Despite this, the central bank highlighted that inflation is still too high, and there won't be any rate cuts in the near future.
The RBA noted a positive outlook for domestic demand, driven by increased public spending and a rebound in household consumption. Additionally, data revealed that Australia's industry index remained in contraction for the 27th straight month in July due to weak domestic and external demand.Though trading on financial markets involves high risk, it can still generate extra income in case you apply the right approach. By choosing a reliable broker such as InstaForex you get access to the international financial markets and open your way towards financial independence. You can sign up here.
-
The Following 14 Users Say Thank You to Solid ECN For This Useful Post:
Unregistered (14)
-
Senior Member
- Join Date
- Oct 2022
- Posts
- 1,334
- Thanks
- 1
- Thanked 2,413 Times in 751 Posts
BoE's Expected Rate Cuts Shake GBP/USD and Bond Yield

Solid ECN—The British pound has dropped to $1.27, nearing a one-month low, as investors predict quicker interest rate cuts by the Bank of England. This decrease coincides with growing fears of a US recession, leading to British government bond yields hitting new multi-month lows. Markets are expecting the BoE to implement two quarter-point rate cuts by December.
On Monday, interest rate futures predicted 56 basis points of cuts for this year, up from 47 basis points expected on Friday. Additionally, two-year gilt yields, sensitive to changes in borrowing costs, decreased by 8 basis points to 3.526%, the lowest since April 2023. Last week, the BoE reduced its benchmark interest rate from a 16-year high of 5.25% to 5.0%, marking the first cut since 2020.Though trading on financial markets involves high risk, it can still generate extra income in case you apply the right approach. By choosing a reliable broker such as InstaForex you get access to the international financial markets and open your way towards financial independence. You can sign up here.
-
The Following 19 Users Say Thank You to Solid ECN For This Useful Post:
Unregistered (19)
-
Senior Member
- Join Date
- Oct 2022
- Posts
- 1,334
- Thanks
- 1
- Thanked 2,413 Times in 751 Posts
USD/CAD Poised for Potential Rebound

Solid ECN—The USD/CAD pair recently declined from 1.394, testing the 100-period simple moving average (SMA) at 1.3786. As of this writing, the price is experiencing a pullback from the critical 1.378 support level. Meanwhile, the immediate resistance stands at 1.383, reinforced by the broken 50-period SMA.
From a technical standpoint, the uptrend will likely resume if the bulls close and stabilize the price above the 50-period SMA, approximately 1.383. Should this occur, the next target would likely be 1.388.
Conversely, if the bears push the price below the 100-period SMA, the downtrend could extend to the next key support at 1.375.Though trading on financial markets involves high risk, it can still generate extra income in case you apply the right approach. By choosing a reliable broker such as InstaForex you get access to the international financial markets and open your way towards financial independence. You can sign up here.
-
The Following 18 Users Say Thank You to Solid ECN For This Useful Post:
Unregistered (18)
-
Senior Member
- Join Date
- Oct 2022
- Posts
- 1,334
- Thanks
- 1
- Thanked 2,413 Times in 751 Posts
GBP/USD: Downtrend Resumption Ahead?
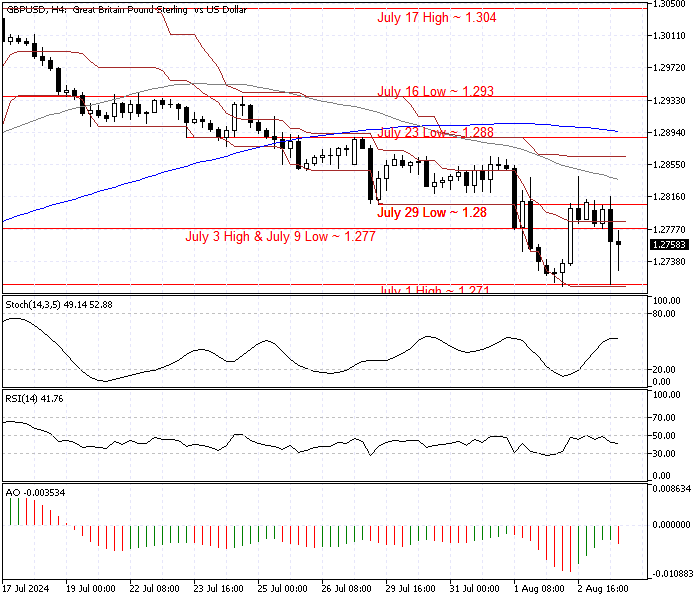
Solid ECN—The GBP/USD pair is in a bear market, trading below the 50 and 100-period simple moving averages. As of this writing, the price of the currency pair is stabilizing below the July 3 high of $1.277.
From a technical standpoint, the bear market is valid as long as the price is below the July 23 low at approximately $1.288. However, the price should dip below the immediate resistance at $1.271 for the downtrend to resume. If this scenario unfolds, the next bearish target will be the $1.261 mark.Though trading on financial markets involves high risk, it can still generate extra income in case you apply the right approach. By choosing a reliable broker such as InstaForex you get access to the international financial markets and open your way towards financial independence. You can sign up here.
-
The Following 17 Users Say Thank You to Solid ECN For This Useful Post:
Unregistered (17)
-
Senior Member
- Join Date
- Oct 2022
- Posts
- 1,334
- Thanks
- 1
- Thanked 2,413 Times in 751 Posts
Oil Prices Test $72.6 Supply Zone

Solid ECN—Oil prices dipped below the $75.1 support level, testing the $72.6 supply zone. The bearish pressure on the WTI Crude Oil price drove the stochastic oscillator into the oversold territory.
From a technical standpoint, we expected the price to consolidate before the downtrend resumed. That said, the price might bounce to fill the 'fair value gap' at approximately $75.1, which should be monitored for bearish candlestick patterns.Though trading on financial markets involves high risk, it can still generate extra income in case you apply the right approach. By choosing a reliable broker such as InstaForex you get access to the international financial markets and open your way towards financial independence. You can sign up here.
-
The Following 12 Users Say Thank You to Solid ECN For This Useful Post:
Unregistered (12)
-
Senior Member
- Join Date
- Oct 2022
- Posts
- 1,334
- Thanks
- 1
- Thanked 2,413 Times in 751 Posts
WTI Crude Oil Bounces from $76.7
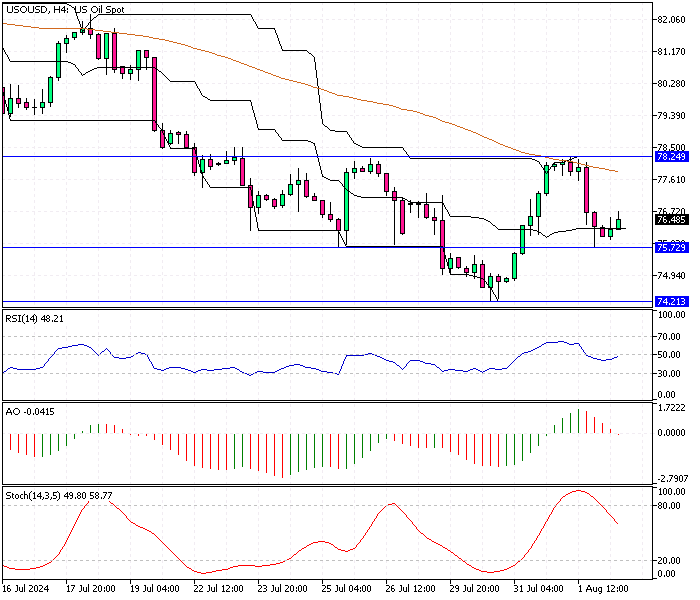
Solid ECN—The oil price dipped to $75.7 after breaking $78.1 with a long bearish candlestick. Currently, the price is bouncing from the key resistance at $75, while the awesome oscillator has flipped below the signal line.
There is no significant pattern on the WTI Crude Oil 4-hour chart, but the 1-hour chart shows a hammer candlestick and a MACD cross, indicating bullish momentum.
The price is likely to test the resistance at $75.7. However, if it dips below $75, the bullish outlook will be invalidated, potentially leading to a retest of July's low at $75.1.Though trading on financial markets involves high risk, it can still generate extra income in case you apply the right approach. By choosing a reliable broker such as InstaForex you get access to the international financial markets and open your way towards financial independence. You can sign up here.
-
The Following 13 Users Say Thank You to Solid ECN For This Useful Post:
Unregistered (13)
-
Senior Member
- Join Date
- Oct 2022
- Posts
- 1,334
- Thanks
- 1
- Thanked 2,413 Times in 751 Posts
Bulls Eye $2,483 as XAU/USD Uptrend Resumes
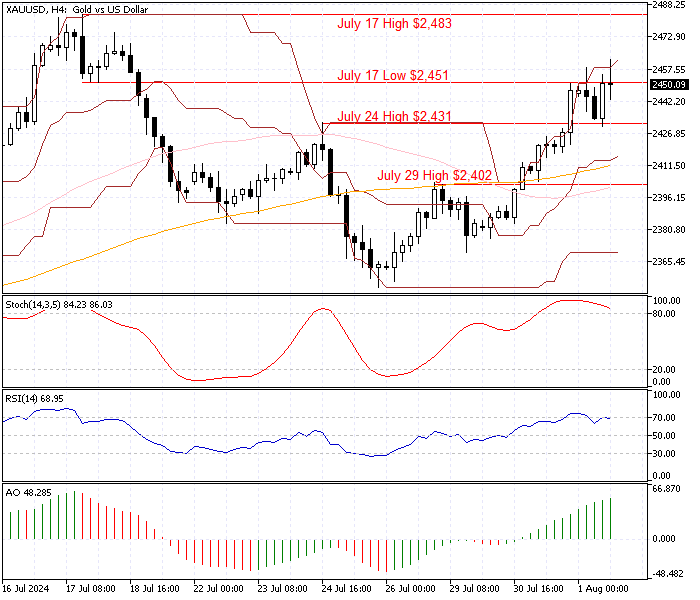
Solid ECN—Gold is in a bull market, testing the July 17 low at $2,451 as resistance. The technical indicators suggest the market is oversold, and the price might consolidate before the uptrend resumes.
However, the bears have tested the July 24 high at $2,431 today, and as a result, the price bounced, and the uptrend resumed. Therefore, if the XAU/USD price remains above $2,431, the next bullish target will likely be the July 17 high at $2,483.
Conversely, a dip below $2,431 could trigger the consolidation phase, extending to the next support level at $2,402.Though trading on financial markets involves high risk, it can still generate extra income in case you apply the right approach. By choosing a reliable broker such as InstaForex you get access to the international financial markets and open your way towards financial independence. You can sign up here.
-
The Following 11 Users Say Thank You to Solid ECN For This Useful Post:
Unregistered (11)
-
Senior Member
- Join Date
- Oct 2022
- Posts
- 1,334
- Thanks
- 1
- Thanked 2,413 Times in 751 Posts
WTI Crude Oil Hits Key Resistance

Solid ECN—WTI Crude Oil price reached the $78.1 key resistance, a demand zone backed by the 75-period simple moving average. Interestingly, the robust bullish momentum eased as the stochastic oscillator stepped into the overbought territory.
The technical indicators suggest the primary trend is bullish, but the oil price could be overvalued in the short term. Therefore, it is likely that the oil price consolidates near the immediate support at $77.1.
Conversely, the uptrend resumes if the bulls close and stabilize the price above $78.1. In this scenario, the next barrier will be the $79.2 mark.Though trading on financial markets involves high risk, it can still generate extra income in case you apply the right approach. By choosing a reliable broker such as InstaForex you get access to the international financial markets and open your way towards financial independence. You can sign up here.
-
The Following 10 Users Say Thank You to Solid ECN For This Useful Post:
Unregistered (10)
-
Senior Member
- Join Date
- Oct 2022
- Posts
- 1,334
- Thanks
- 1
- Thanked 2,413 Times in 751 Posts
Bearish Trend Expected for EUR/USD

Solid ECN—The EUR/USD price returned from the 50-period simple moving average, and as of writing, the pair trades inside the bearish flag at approximately 1.081. The technical indicators suggest the primary trend is bearish and should resume.
From a technical standpoint, the price will likely test the 1.079 level in today's trading session. If the selling pressure exceeds 1.079, the next supply zone will be the 1.077 mark.
Conversely, the bear market should be invalidated if the EUR/USD price exceeds the key resistance level at 1.086, backed by the 100-period simple moving average.Though trading on financial markets involves high risk, it can still generate extra income in case you apply the right approach. By choosing a reliable broker such as InstaForex you get access to the international financial markets and open your way towards financial independence. You can sign up here.
-
The Following 15 Users Say Thank You to Solid ECN For This Useful Post:
Unregistered (15)
Results 11 to 20 of 1354

 Reply With Quote