 Thread:


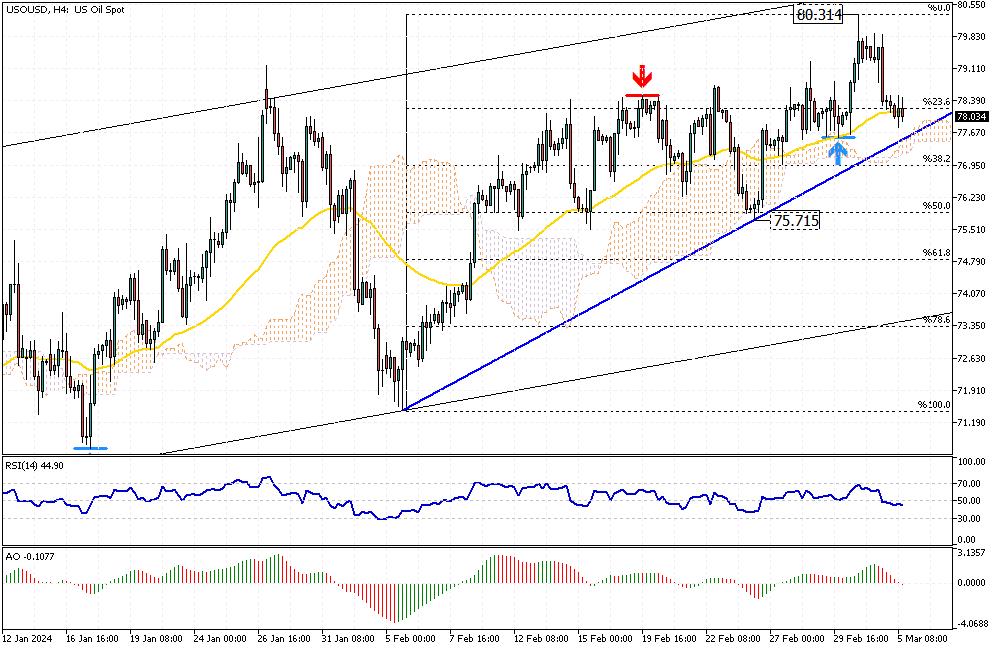
U.S. Oil Technical Analysis
Solid ECN – The U.S. oil price hovers around $78 in today's trading session. The black gold experienced a dip on March 1st after climbing as high as $80 per barrel. The Ichimoku cloud and the ascending trendline have prevented further declines, yet the bear market has not pushed the price down to as low as $77.7.
Technical indicators match the recent price decrease. The RSI indicator and the Awesome Oscillator have dipped below the signal line. From a technical standpoint, the bearish pressure may increase if the price falls below the ascending trendline, depicted in blue.
Conversely, given the primary bullish trend, if the ascending trendline holds steady, the oil price could see a new bullish wave aiming for March's highs, followed by the $82 mark.
Malaysia Forex Forum
- Forum
- Forex Charts
- Monitoring
- Forex TV

-
Senior Member


- Join Date
- Oct 2022
- Posts
- 1,164
- Thanks
- 1
- Thanked 1,377 Times in 448 Posts
Though trading on financial markets involves high risk, it can still generate extra income in case you apply the right approach. By choosing a reliable broker such as InstaForex you get access to the international financial markets and open your way towards financial independence. You can sign up here.
-
Senior Member
- Join Date
- Oct 2022
- Posts
- 1,164
- Thanks
- 1
- Thanked 1,377 Times in 448 Posts
AUDUSD Experiences Pullback from Fibonacci Level
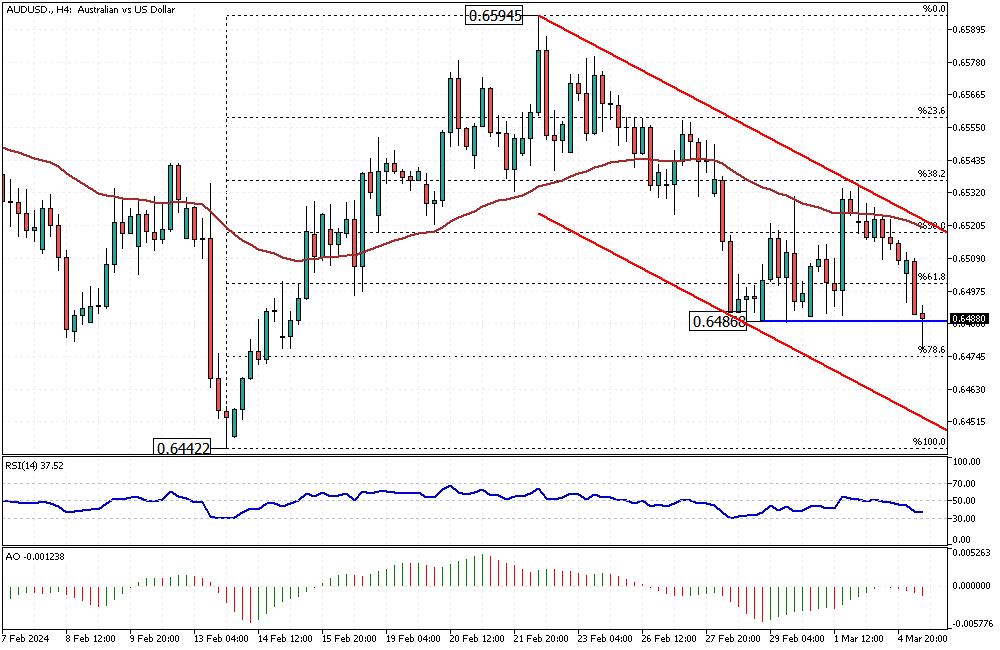
Solid ECN – The Australian dollar has crossed below the 0.648 resistance level against the U.S. Dollar. The pair bounced from the 78.6% Fibonacci support level and is trading at approximately 0.648 at the time of writing. Upon examining the AUDUSD 4-hour chart, we notice that the price is declining within the bearish channel. The technical indicators support the primary trend, with the RSI hovering below 50, and the Awesome Oscillator bars are red and below the signal line.
Currently, the pair is experiencing a pullback from the aforementioned Fibonacci level, which may extend to the 61.8% resistance level, followed by the upper band of the flag.
From a technical standpoint, the AUDUSD is in a bear market, and the downtrend will likely continue. The next target could be 0.6442, the lower low of February.
Conversely, the bear market should be considered invalid if the AUDUSD price rises above 0.6524, above the 50% Fibonacci resistance level.Though trading on financial markets involves high risk, it can still generate extra income in case you apply the right approach. By choosing a reliable broker such as InstaForex you get access to the international financial markets and open your way towards financial independence. You can sign up here.
-
Senior Member
- Join Date
- Oct 2022
- Posts
- 1,164
- Thanks
- 1
- Thanked 1,377 Times in 448 Posts
Bullish Outlook: GBP USD's Potential to Overcome Resistance
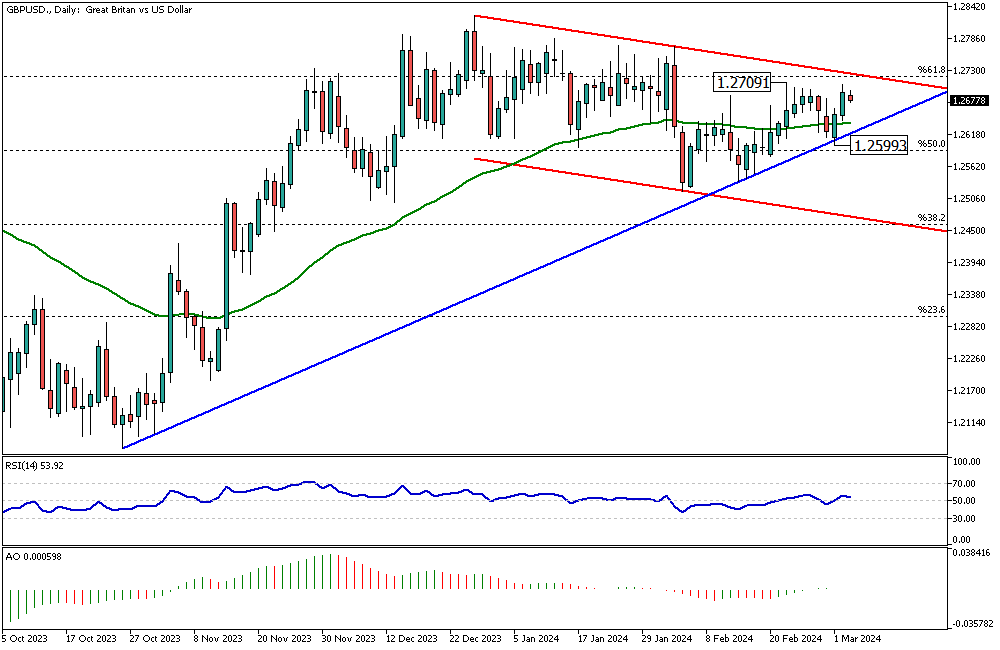
Solid ECN – The pound sterling is stabilizing at around 1.267 against the U.S. dollar, above the 50 EMA but slightly below the 61.8% Fibonacci resistance. The GBPUSD daily chart shows that the pair has traded sideways since mid-November 2023.
While the technical indicators don't provide anything significant, from a technical standpoint, the primary trend is bullish. As long as the pair trades above the ascending trendline, depicted in blue, we expect the market to surpass the 1.270 barrier and aim for the 78.6% Fibonacci resistance.
Conversely, the bearish channel will remain valid if the price falls below the ascending trendline. In this scenario, the next target for the sellers would be the 38.2% Fibonacci level.Though trading on financial markets involves high risk, it can still generate extra income in case you apply the right approach. By choosing a reliable broker such as InstaForex you get access to the international financial markets and open your way towards financial independence. You can sign up here.
-
Senior Member
- Join Date
- Oct 2022
- Posts
- 1,164
- Thanks
- 1
- Thanked 1,377 Times in 448 Posts
Boost Your Trading with Solid ECN - Enjoy a 15% Deposit Bonus!
Solid ECN – Trading forex and other leveraged products requires having more margin.
At Solid ECN, we've got your back! We offer a 15% boost on your deposits, up to $500 per account. Plus, all profits from your trading can be withdrawn without hassle. Unlike other companies that might remove bonuses during margin calls, our bonus is 100% tradable and can be fully utilized in your trades.
We're taking on 15% more risk to ensure you trade more confidently. Try Solid ECN today and share your trading journey with us!
https://solidecn.com >>> %15 Bonus | Swap Free | Raw Spread | RegulatedThough trading on financial markets involves high risk, it can still generate extra income in case you apply the right approach. By choosing a reliable broker such as InstaForex you get access to the international financial markets and open your way towards financial independence. You can sign up here.
-
Senior Member
- Join Date
- Oct 2022
- Posts
- 1,164
- Thanks
- 1
- Thanked 1,377 Times in 448 Posts
EURUSD Analysis: A Close Look at Key Fibonacci Levels
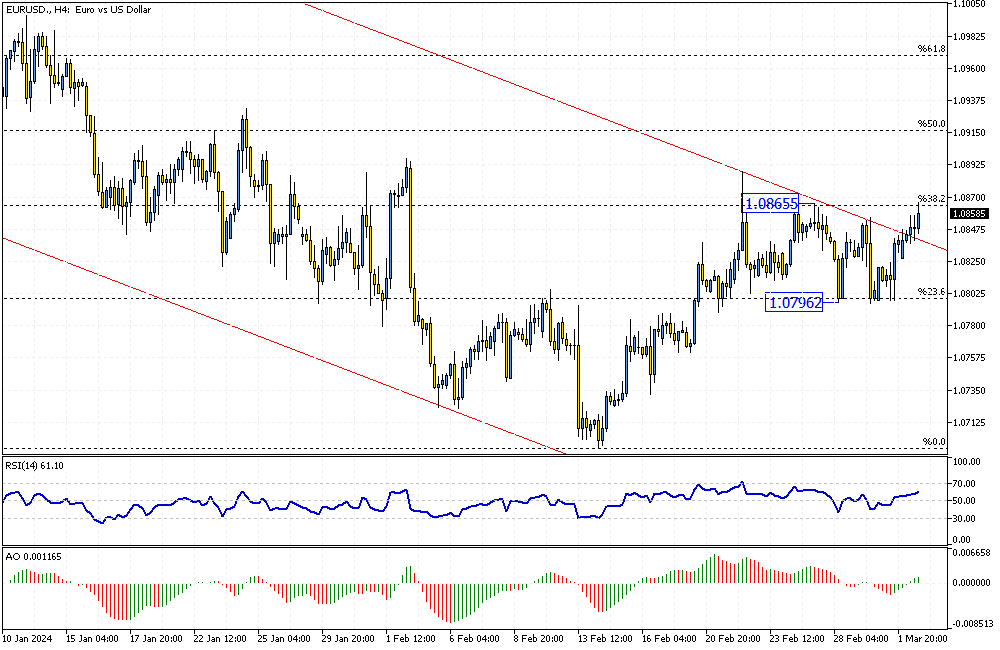
Solid ECN – The EURUSD is trading around 1.0856, slightly below the 38.2% Fibonacci retracement level. Interestingly, the bulls have managed to break above the bearish channel. However, Euro buyers must overcome the 1.0865 barrier for the uptrend to continue. The technical indicators support a bullish market, with the RSI hovering above 50 and the Awesome Oscillator bars turning green and rising above the signal line.
From a technical standpoint, the bulls will likely target the 50% Fibonacci retracement level if they can stabilize the price above 1.0865.
Conversely, if the EURUSD price falls below the 1.0796 mark, representing the 23.6% Fibonacci support, the decline that began in December 2023 will likely resume.Though trading on financial markets involves high risk, it can still generate extra income in case you apply the right approach. By choosing a reliable broker such as InstaForex you get access to the international financial markets and open your way towards financial independence. You can sign up here.
-
Senior Member
- Join Date
- Oct 2022
- Posts
- 1,164
- Thanks
- 1
- Thanked 1,377 Times in 448 Posts
Gold Prices Stay High Amid Steady US Inflation Data
Solid ECN – Gold prices remained above $2,040 an ounce last Friday, marking the second week of gains. This trend follows the latest U.S. inflation data, which met expectations and continued to support the anticipation of Federal Reserve interest rate reductions this year. The recent data revealed that core PCE prices in the U.S., an inflation measure closely watched by the Fed, increased by 0.4% month-over-month in January. This is a jump from the 0.1% rise seen in December, aligning with forecasts.
Furthermore, New York Fed President John Williams commented that he anticipates the central bank will lower interest rates later in the year, driven by decreasing inflation and a stable economy. He also mentioned that he doesn't foresee circumstances requiring another Fed rate hike.
Currently, the market anticipates roughly a two-thirds likelihood of a Fed rate reduction in June, with expectations for no changes in March and May.Though trading on financial markets involves high risk, it can still generate extra income in case you apply the right approach. By choosing a reliable broker such as InstaForex you get access to the international financial markets and open your way towards financial independence. You can sign up here.
-
Senior Member
- Join Date
- Oct 2022
- Posts
- 1,164
- Thanks
- 1
- Thanked 1,377 Times in 448 Posts
Silver Prices Surge Amid US Economic Updates
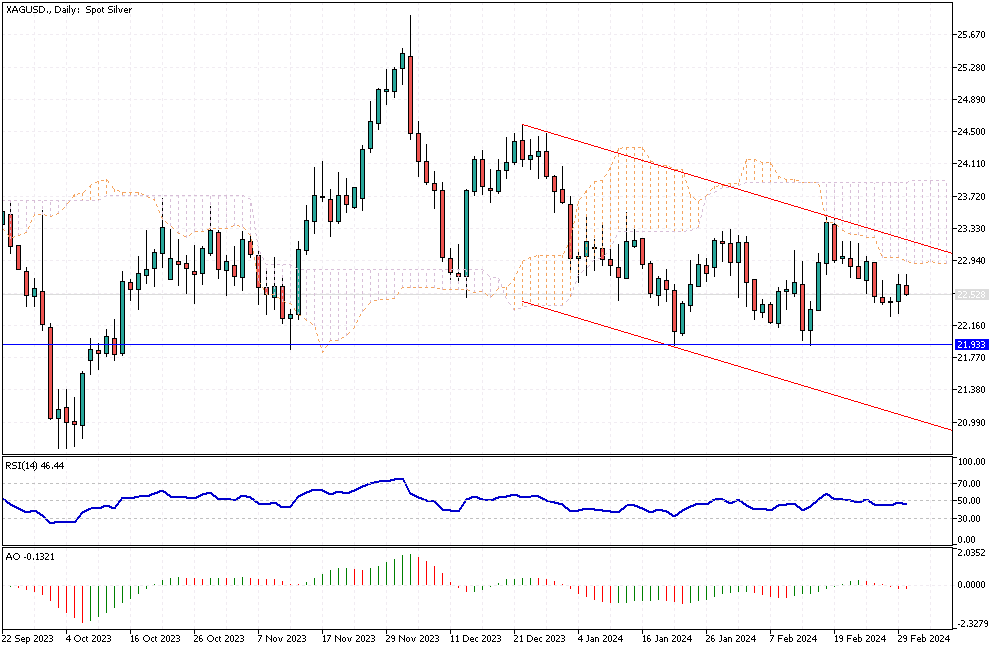
Solid ECN – Silver's price rose above $22.5 per ounce, thanks to a weaker US dollar, as market players reacted positively to new economic data from the US. The Federal Reserve closely monitors the core PCE price index, which increased by 0.4% from January last month, aligning with analysts' predictions.
Furthermore, the year-on-year rates have hit their lowest point since 2021, reinforcing the view that inflation is staying on its expected path. In other developments, initial jobless claims were slightly higher than expected, reducing concerns over an overly tight job market. Market participants anticipate 79 basis points in Fed rate cuts in 2023, with expectations for the initial reduction in June. As borrowing costs fall, the attractiveness of non-income-generating assets like silver increases.Though trading on financial markets involves high risk, it can still generate extra income in case you apply the right approach. By choosing a reliable broker such as InstaForex you get access to the international financial markets and open your way towards financial independence. You can sign up here.
-
Senior Member
- Join Date
- Oct 2022
- Posts
- 1,164
- Thanks
- 1
- Thanked 1,377 Times in 448 Posts
USDJPY Experiences Significant Downward Momentum
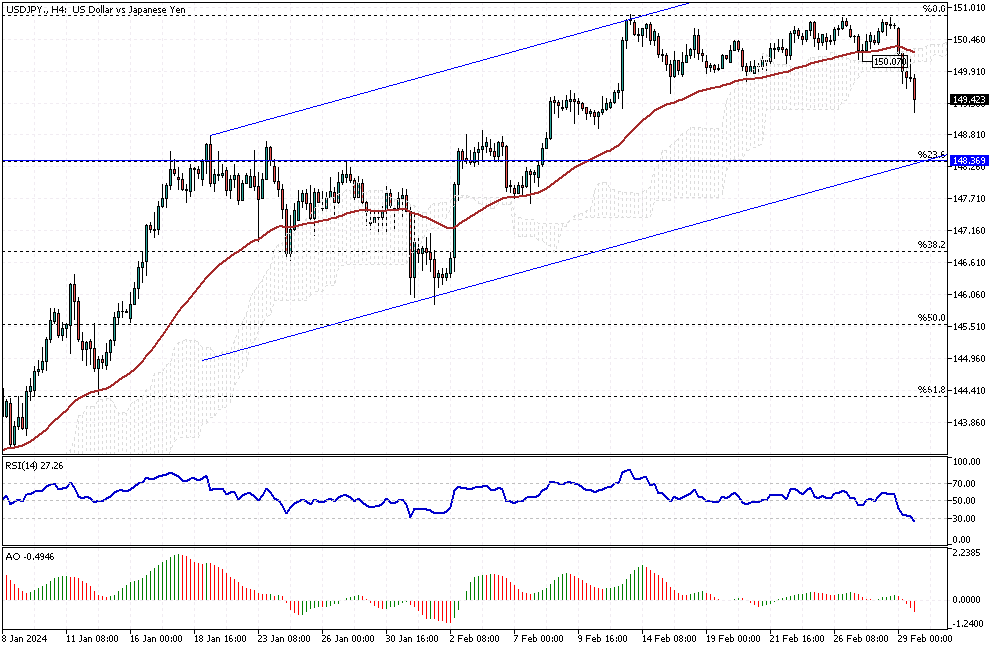
Solid ECN – The USDJPY is experiencing significant downward momentum in today’s trading session. The pair has crossed below the Ichimoku cloud and is trading around 149.2 at the time of writing. Interestingly, the RSI indicator has entered the oversold area below 30. Therefore, considering the primary trend is bullish, the price might test the previously broken support, the Ichimoku cloud.
From a technical standpoint, the data from the USDJPY 4-hour chart indicates that the uptrend will be on pause for a while, and the decline will likely extend to the 23.6% Fibonacci support, corresponding to the 148.3 mark.
On the flip side, bulls must push the price above the Ichimoku cloud again for the uptrend to continue.Though trading on financial markets involves high risk, it can still generate extra income in case you apply the right approach. By choosing a reliable broker such as InstaForex you get access to the international financial markets and open your way towards financial independence. You can sign up here.
-
Senior Member
- Join Date
- Oct 2022
- Posts
- 1,164
- Thanks
- 1
- Thanked 1,377 Times in 448 Posts
Gold Price Analysis: Potential Bullish Breakout
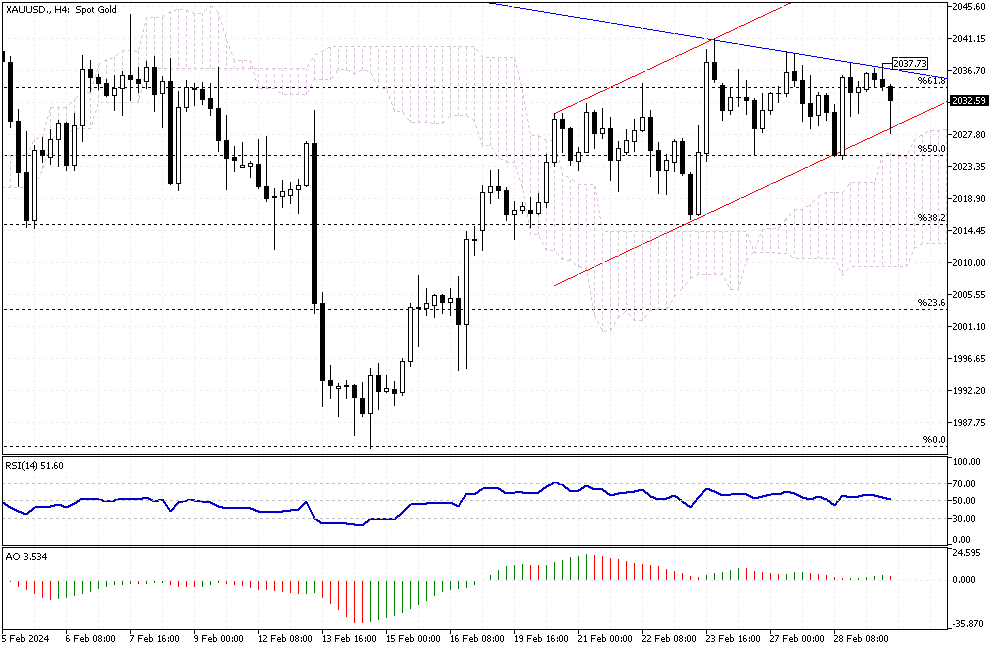
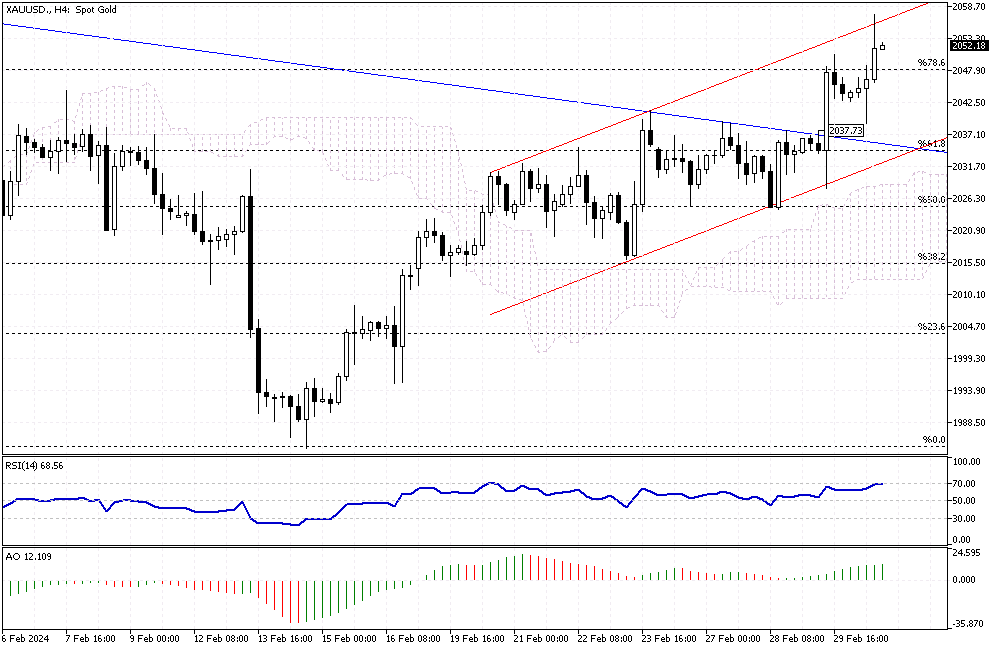
Solid ECN – The yellow metal is testing the $2,037 mark. What distinguishes this resistance area is its conjunction with the 61.8% Fibonacci level and the descending trendline, depicted in blue.
Upon examining the price action, we observe that the divergence in the awesome oscillator couldn't initiate a shift in the market. Consequently, the Gold price remained above the 50% Fibonacci level and the Ichimoku cloud. With the RSI indicator hovering above the 50 lines, it is likely for the price to make a bullish breakout and climb to the 78.6% Fibonacci resistance, corresponding to the $2,048 mark.
On the other hand, if the XAU/USD price dips and stabilizes below the 50% Fibonacci support, the bullish analysis will be invalidated. In such a scenario, the price might experience a further decline to the 38.2% level.Though trading on financial markets involves high risk, it can still generate extra income in case you apply the right approach. By choosing a reliable broker such as InstaForex you get access to the international financial markets and open your way towards financial independence. You can sign up here.
-
Senior Member
- Join Date
- Oct 2022
- Posts
- 1,164
- Thanks
- 1
- Thanked 1,377 Times in 448 Posts
AUDUSD Analysis: Breaking Bullish Trends and Testing Fibo Level
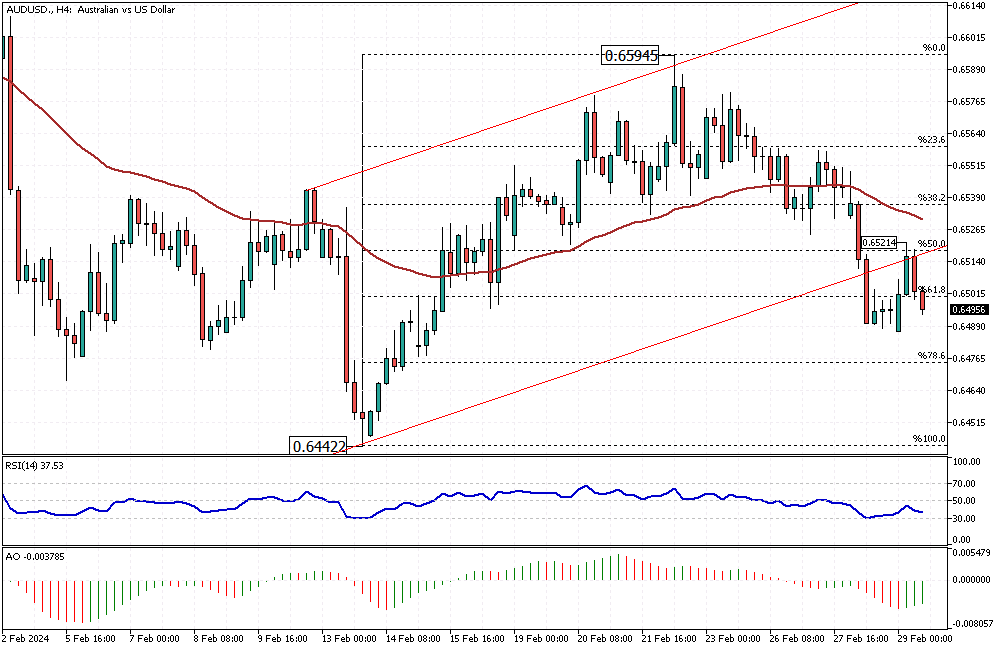
Solid ECN – The U.S. dollar broke below the ascending bullish channel in yesterday's trading session against the Australian dollar. Interestingly, the pair tested the broken support, which now acts as resistance, specifically at the 50% Fibonacci level or the 0.6521 mark.
The technical indicators give mixed signals: the RSI is bearish, while the Awesome Oscillator signals a bull market.
Based on the price action, the 50% Fibonacci level plays as resistance, and it is expected for the downtrend to extend to the 78.6% Fibonacci support, followed by the February low at 0.6442.
The bearish outlook for the AUD/USD pair should be invalidated if the price stabilizes itself above the 50% Fibonacci level.Though trading on financial markets involves high risk, it can still generate extra income in case you apply the right approach. By choosing a reliable broker such as InstaForex you get access to the international financial markets and open your way towards financial independence. You can sign up here.
Results 101 to 110 of 1180

 Reply With Quote