 Thread:


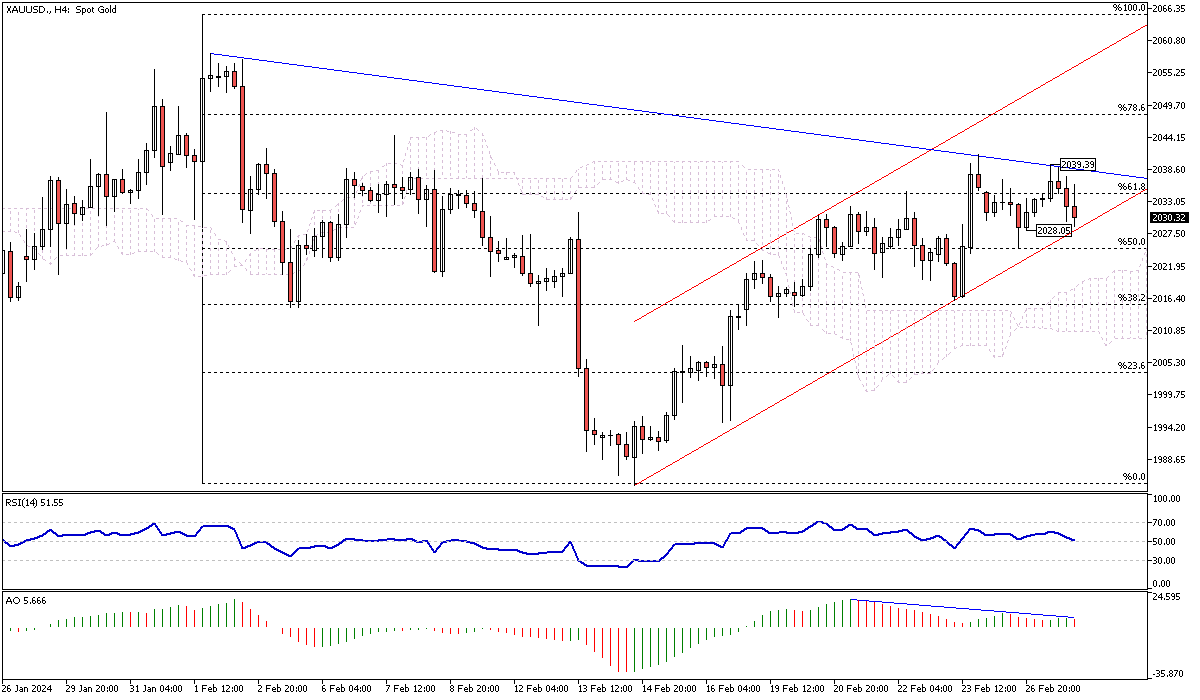
Gold Analysis: Bearish Signals Emerge Amid Technical Indicators
Solid ECN – The price of gold has fallen to \$2,030 against the U.S. dollar, reaching the lower band of the bullish flag, depicted in red. The Awesome Oscillator indicator shows signs of divergence, suggesting that the bears attempt to cross below the \$2,028 threshold. Adding to this bearish sentiment, the Relative Strength Index (RSI) indicator is closing below the median line, lending credibility to the recent XAU/USD price decline.
From a technical perspective, for the bull market to continue, the price of gold needs to stabilize above the 61.8% Fibonacci retracement level, a task that it failed to achieve this week.
On the flip side, if the price crosses the bullish flag and maintains a position below the \$2,039 resistance level, the decline will likely extend its reach to the Ichimoku cloud, a resistance level further powered by the 50% Fibonacci level.
Malaysia Forex Forum
- Forum
- Forex Charts
- Monitoring
- Forex TV

-
Senior Member


- Join Date
- Oct 2022
- Posts
- 1,147
- Thanks
- 1
- Thanked 1,377 Times in 448 Posts
Though trading on financial markets involves high risk, it can still generate extra income in case you apply the right approach. By choosing a reliable broker such as InstaForex you get access to the international financial markets and open your way towards financial independence. You can sign up here.
-
Senior Member
- Join Date
- Oct 2022
- Posts
- 1,147
- Thanks
- 1
- Thanked 1,377 Times in 448 Posts
EURUSD Trading at 1.085 Amid Multiple Resistance Levels
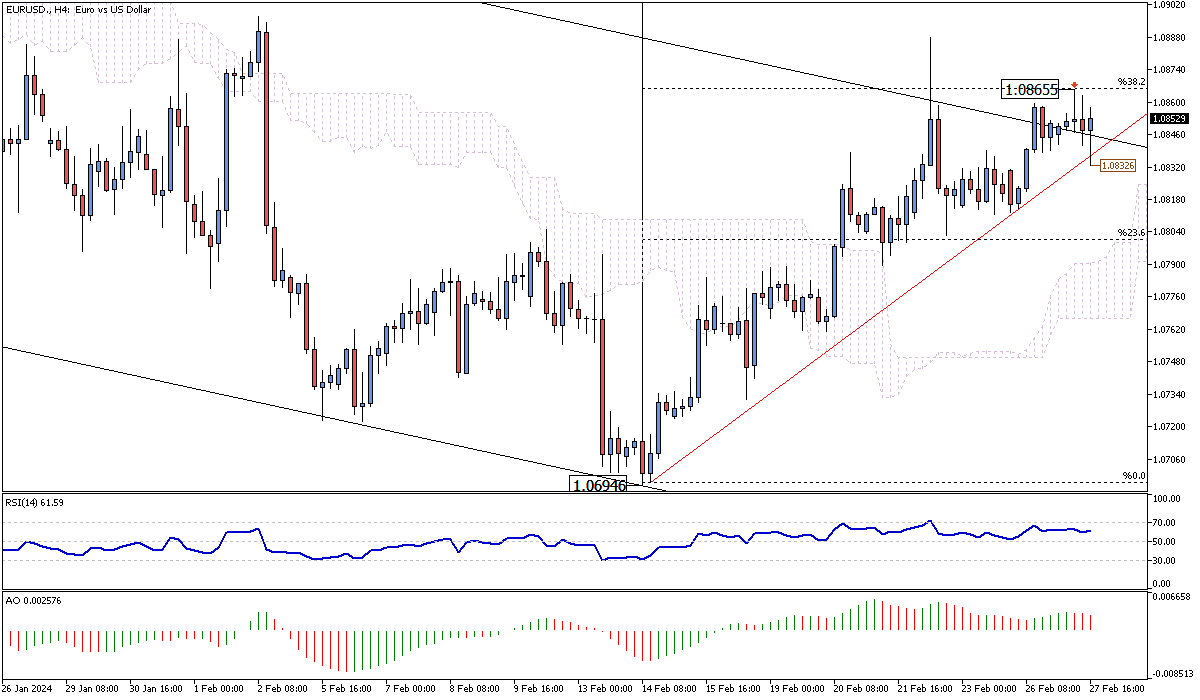
Solid ECN – The EURUSD currency pair trades around 1.085 today. Currently, the price is in conjunction with multiple resistance levels. These include the 38.2% Fibonacci support, the upper band of the bearish flag, and the rising trendline. While the technical indicators give mixed signals, the EURUSD 4-hour chart has formed a long-wick candlestick pattern, which can be interpreted as the bears being more active than the bulls in the current session.
From a technical standpoint, the primary trend remains bearish as long as the price is suppressed below 1.0865s, the 38.2% Fibonacci retracement level. However, for the downtrend to continue, the price must fall below the ascending, precisely the 1.0832 mark.
On the other hand, the uptick momentum that began on February 13th should continue if the bulls cross above the Fibonacci level under discussion and maintain a position above it.Though trading on financial markets involves high risk, it can still generate extra income in case you apply the right approach. By choosing a reliable broker such as InstaForex you get access to the international financial markets and open your way towards financial independence. You can sign up here.
-
Senior Member
- Join Date
- Oct 2022
- Posts
- 1,147
- Thanks
- 1
- Thanked 1,377 Times in 448 Posts
USDJPY Pair Analysis: Bullish Channel and Ichimoku Cloud
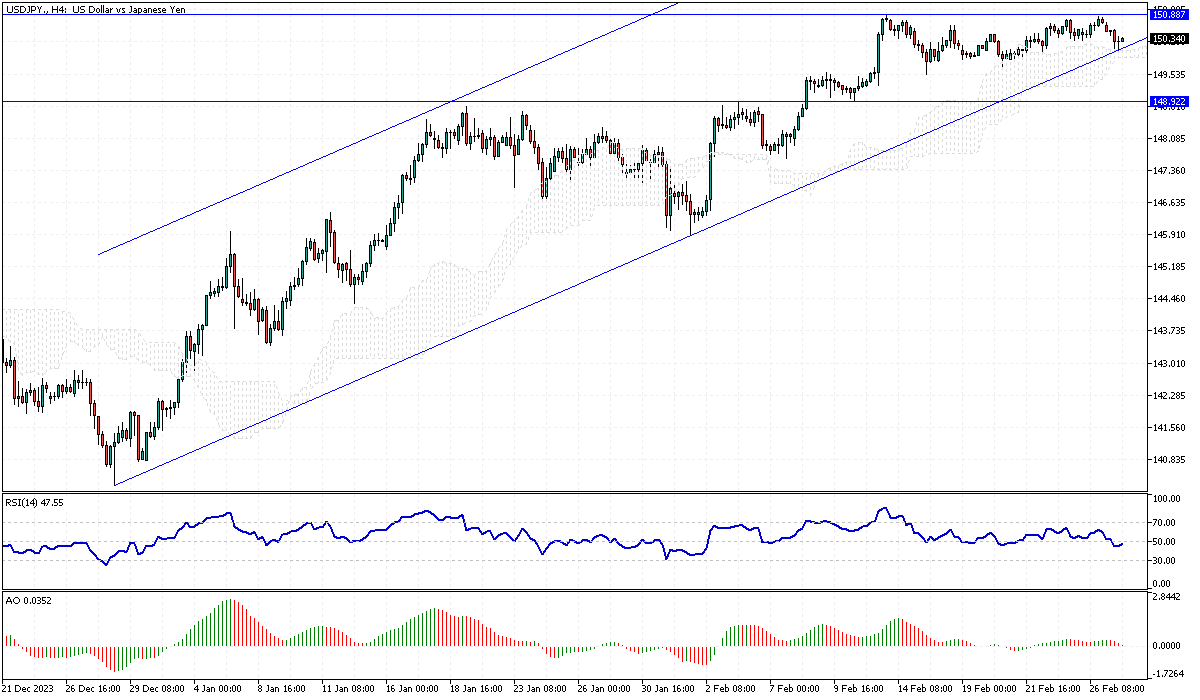
Solid ECN – The USDJPY pair is testing the lower band of the bullish channel, which coincides with the Ichimoku cloud. The 4-hour chart has formed a doji candlestick, which can be interpreted as a signal for the continuation of the bull market.
From a technical standpoint, if the Ichimoku cloud remains intact, the bullish trend should continue, and the first milestone would be the 150.8 resistance.
On the other hand, if the USDJPY price falls below the Ichimoku cloud, the consolidation might extend to the 148.9 support.Though trading on financial markets involves high risk, it can still generate extra income in case you apply the right approach. By choosing a reliable broker such as InstaForex you get access to the international financial markets and open your way towards financial independence. You can sign up here.
-
Senior Member
- Join Date
- Oct 2022
- Posts
- 1,147
- Thanks
- 1
- Thanked 1,377 Times in 448 Posts
Unlock Your Trading Potential with Solid ECN's Free Market Analysis Subscription!
At Solid ECN, we're more than just a team. We're a group of dedicated professionals committed to providing daily market analysis across six platforms. Our comprehensive approach combines both fundamental and technical aspects to give you the edge in today's fast-paced trading environment.
> Website
> Email
> Linkedin
> Twitter
> Instagram
> Facebook
Stay Ahead of the Curve - Sign up for a demo account today and receive the latest market updates directly to your inbox. Or, join our growing community on social media to stay connected and informed.
Our in-depth analysis empowers our clients to trade more efficiently, minimize losses, and pinpoint entry and exit points with ease. Join us at Solid ECN and let's navigate the markets together!Though trading on financial markets involves high risk, it can still generate extra income in case you apply the right approach. By choosing a reliable broker such as InstaForex you get access to the international financial markets and open your way towards financial independence. You can sign up here.
-
Senior Member
- Join Date
- Oct 2022
- Posts
- 1,147
- Thanks
- 1
- Thanked 1,377 Times in 448 Posts
Natural Gas Prices Edge Up Amid Oversupply Issues
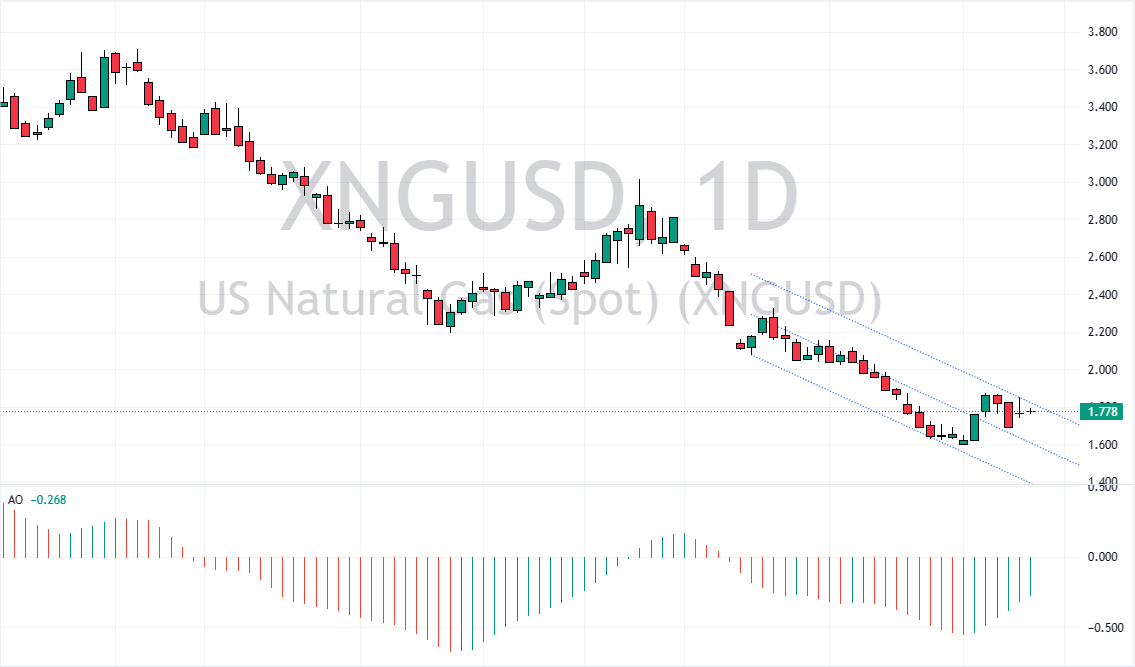
Solid ECN – US natural gas prices slightly increased to just over $1.65 per million British thermal units (MMBtu) after falling by 7.5% in the previous session. This change is happening as the market deals with an excess supply, high levels of storage, and reduced need for heating because of the hot winter. Nevertheless, there is some upward pressure on prices as producers cut back on how much they produce.
Although there was a short interruption in supply in January because of freezing weather, gas production is still at all-time highs. The warm conditions have resulted in much higher than average gas reserves, with recent data from the Energy Information Administration indicating that storage is 22.3% above normal levels. Chesapeake Energy has reduced its production outlook for 2024 by about 30% after a significant price fall to the lowest point in over three years. Important companies like Antero Resources, Comstock Resources, and EQT have also reduced their drilling and production activities due to the current market scenario.Though trading on financial markets involves high risk, it can still generate extra income in case you apply the right approach. By choosing a reliable broker such as InstaForex you get access to the international financial markets and open your way towards financial independence. You can sign up here.
-
Senior Member
- Join Date
- Oct 2022
- Posts
- 1,147
- Thanks
- 1
- Thanked 1,377 Times in 448 Posts
NZDUSD: Inside Bullish Channel and Above Fibonacci Resistance
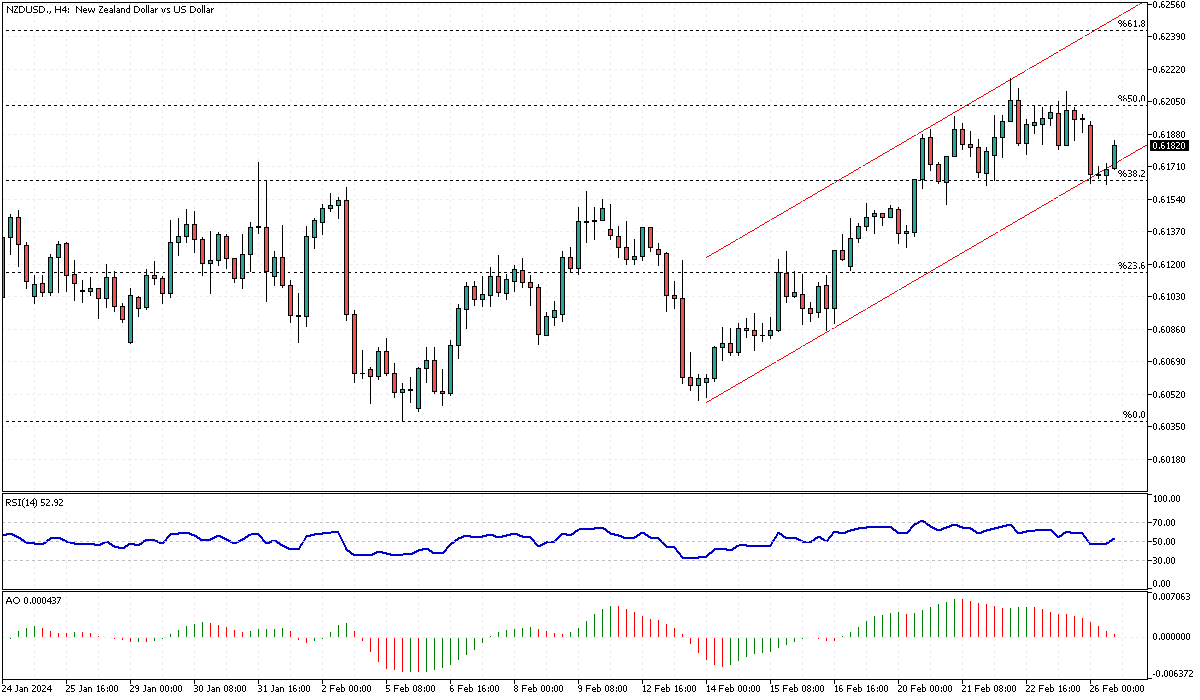
The NZDUSD pair is trading around 0.6180, inside the bullish channel and above the 38.2% Fibonacci resistance level. Although the technical indicators are giving mixed signals, from a technical standpoint, the trend is bullish.
As long as the Fibonacci level holds, the next milestone for the pair could be the 61.8% Fibonacci resistance, which is the 0.6239 mark.Though trading on financial markets involves high risk, it can still generate extra income in case you apply the right approach. By choosing a reliable broker such as InstaForex you get access to the international financial markets and open your way towards financial independence. You can sign up here.
-
Senior Member
- Join Date
- Oct 2022
- Posts
- 1,147
- Thanks
- 1
- Thanked 1,377 Times in 448 Posts
AUDUSD Trading Analysis: Clinging to Fibonacci Support and 50 EMA
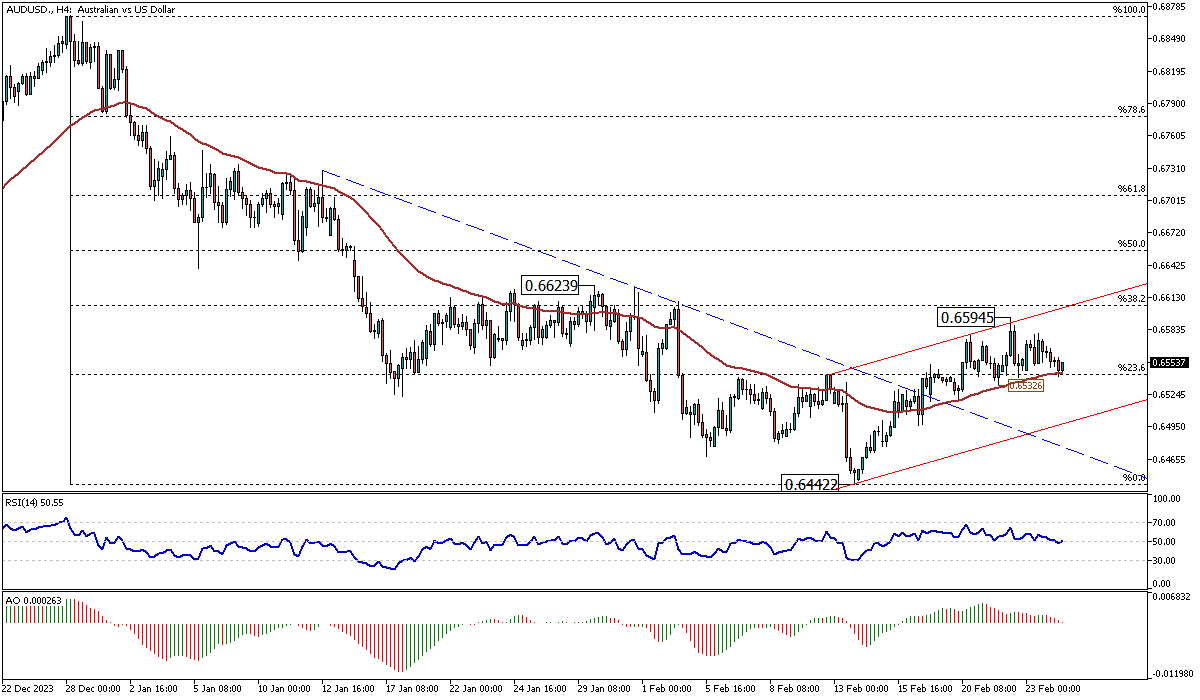
Solid ECN – In today's trading sessions, the Australian dollar trades around 0.655 against the U.S. Dollar, clinging to the 23.6% Fibonacci support and the 50 EMA. However, other technical indicators are providing a bearish signal. The RSI indicator has crossed below the median line, and the bars of the awesome oscillator have turned red and are about to flip below the signal line.
From a technical standpoint, the 0.6532 level supports the bullish momentum, which broke out from the descending trendline, depicted in blue on the AUDUSD 4-hour chart. If the price stays above this level, the 38.2% Fibonacci support could still be the target. This resistance level is further supported by the upper line of the bullish flag, depicted in red on the chart.
Despite these factors, the bullish scenario seems weak for this pair. This can be figured from the candlesticks, where the number of full-bodied bear candles exceeds the bull candles.
Conversely, if the AUDUSD price falls below the 50 EMA, the decline from 0.6594 could lead to the bottom of the bullish flag. This scenario is more likely to play out.
Therefore, traders should monitor the 50 exponential moving average closely.Though trading on financial markets involves high risk, it can still generate extra income in case you apply the right approach. By choosing a reliable broker such as InstaForex you get access to the international financial markets and open your way towards financial independence. You can sign up here.
-
Senior Member
- Join Date
- Oct 2022
- Posts
- 1,147
- Thanks
- 1
- Thanked 1,377 Times in 448 Posts
GBPUSD Bullish Trend Faces Slowdown
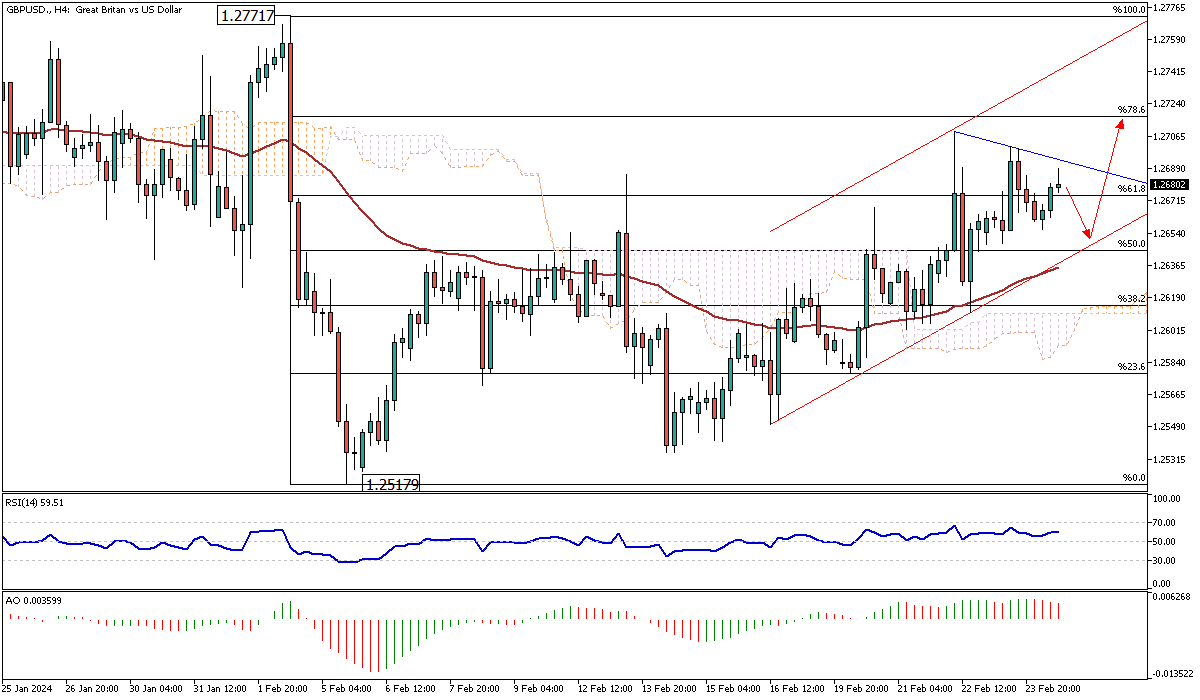
Solid ECN – The GBPUSD trades inside the bullish channel and above the 50 exponential moving average (EMA). This indicates that the primary trend is bullish. However, the awesome oscillator shows signs of a slowdown in the trend.
From a technical standpoint, the 50%Fibonacci retracement level supports the bull market, and the bottom line of the flag further supports this zone. Therefore, as long as the pair trades above it, the technical analysis for the GBPUSD predicts more upward momentum. In this case, the channel's upper band can be considered the next bullish target. It is worth noting that the price must exceed the declining trendline, depicted in blue, to reach the target.
Conversely, the above technical analysis would be invalidated if the price falls below %50 Fibonacci. If this scenario continues, traders should wait to see how the price reacts to the 50 EMA and the Ichimoku cloud support zone.Though trading on financial markets involves high risk, it can still generate extra income in case you apply the right approach. By choosing a reliable broker such as InstaForex you get access to the international financial markets and open your way towards financial independence. You can sign up here.
-
Senior Member
- Join Date
- Oct 2022
- Posts
- 1,147
- Thanks
- 1
- Thanked 1,377 Times in 448 Posts
Trade Easily with MetaTrader 5 Web - Solid ECN
The MetaTrader 5 online platform lets you trade Forex, stocks, and futures from any web browser and system, such as Windows, Mac, or Linux. Enjoy the full features of the MetaTrader 5 desktop version directly online without downloading or installing. Analyze market data and execute trades quickly. Log into your account and begin trading with just a few mouse clicks. Web-based trading on this platform is secure, with all transmitted data being fully encrypted.
Enjoy benefits like 1:1000 leverage, a 15% deposit bonus, rapid transaction speeds, protection against negative balances, and our refund policy.
https://solidecn.com
%15 Bonus | Swap Free | Raw Spread | RegulatedThough trading on financial markets involves high risk, it can still generate extra income in case you apply the right approach. By choosing a reliable broker such as InstaForex you get access to the international financial markets and open your way towards financial independence. You can sign up here.
-
Senior Member
- Join Date
- Oct 2022
- Posts
- 1,147
- Thanks
- 1
- Thanked 1,377 Times in 448 Posts
Bitcoin's Uptrend Amid Range-Bound Trading and EMA Support
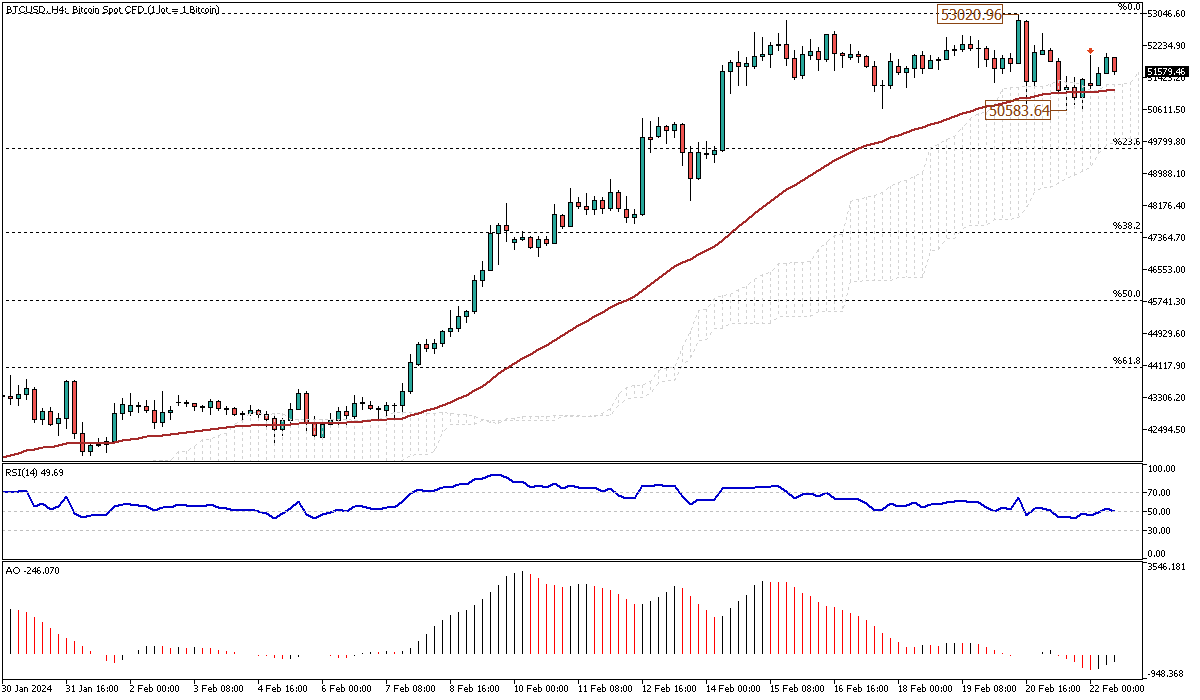
Solid ECN – Bitcoin has been between $50,000 and $53,000 and has stayed above the 50 EMA, as shown in the 4-hour chart. When writing, the BTCUSD is trading around $51,600, with the technical indicators promising a continuation of the uptrend.
The RSI indicator flips above 50, and the AO bars have turned green.
The $50,583 level serves as the support to the primary bullish trend. Therefore, from a technical standpoint, if this minor support holds, the uptrend will likely continue, with $53,020 as its first target, followed by the psychological resistance level at $55,000.
On the flip side, if the BTCUSD price falls below the 50 EMA, the 23.6% Fibonacci retracement level will be the first barrier for the bears to confront. This level is further backed up by the Ichimoku cloud, which makes it an exciting price area for the bulls to add new bids.Though trading on financial markets involves high risk, it can still generate extra income in case you apply the right approach. By choosing a reliable broker such as InstaForex you get access to the international financial markets and open your way towards financial independence. You can sign up here.
Results 101 to 110 of 1163

 Reply With Quote