 Thread:


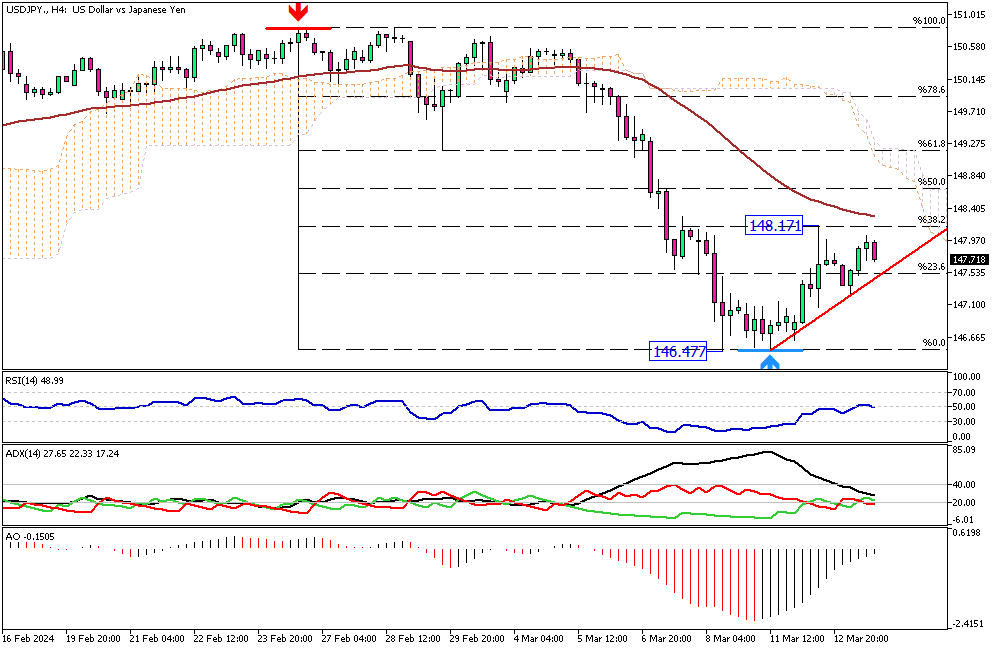
Mixed Indicators for the USDJPY
The U.S. dollar recovered from 146.4 and tested the 38.2% Fibonacci resistance at 148.1. The EMA 50 and the Ichimoku cloud reinforce this resistance level, making it more robust.
The RSI and the AO indicators signal a bull market; however, the ADX indicates a slowdown in market momentum, which could be interpreted as a halt in the recent uptick bias.
From a technical standpoint, we are in a bear market, and the current bullish wave could be a consolidation phase. Therefore, the market will likely decline if the price remains below the EMA 50. A break below the ascending trendline, depicted in red, can trigger selling pressures.
Conversely, if the USDJPY bulls can cross the EMA 50 and stabilize the price above it, the bear market should be invalidated, and traders should reevaluate the market.
Malaysia Forex Forum
- Forum
- Forex Charts
- Monitoring
- Forex TV

-
Senior Member


- Join Date
- Oct 2022
- Posts
- 1,182
- Thanks
- 1
- Thanked 1,564 Times in 522 Posts
Though trading on financial markets involves high risk, it can still generate extra income in case you apply the right approach. By choosing a reliable broker such as InstaForex you get access to the international financial markets and open your way towards financial independence. You can sign up here.
-
The Following 4 Users Say Thank You to Solid ECN For This Useful Post:
Unregistered (4)
-
Senior Member
- Join Date
- Oct 2022
- Posts
- 1,182
- Thanks
- 1
- Thanked 1,564 Times in 522 Posts
GBPUSD Uptrend Signals: RSI Indicator's Positive Shift

Solid ECN – The pound sterling is coming back from the 50 EMA, and as of writing, it is trading at about 1.279. The ascending trendline depicted in red provides support alongside the EMA 50. Interestingly, The RSI indicator has returned above the signal line, indicating that the uptrend will likely resume.
From a technical standpoint, as long as GBPUSD trades above the 1.2745 mark, the bull market will remain valid and will likely aim for the 50% Fibonacci resistance, followed by the 61.8%.
Conversely, a dip below the EMA 50 would invalidate the bullish market.Though trading on financial markets involves high risk, it can still generate extra income in case you apply the right approach. By choosing a reliable broker such as InstaForex you get access to the international financial markets and open your way towards financial independence. You can sign up here.
-
The Following 7 Users Say Thank You to Solid ECN For This Useful Post:
Unregistered (7)
-
Senior Member
- Join Date
- Oct 2022
- Posts
- 1,182
- Thanks
- 1
- Thanked 1,564 Times in 522 Posts
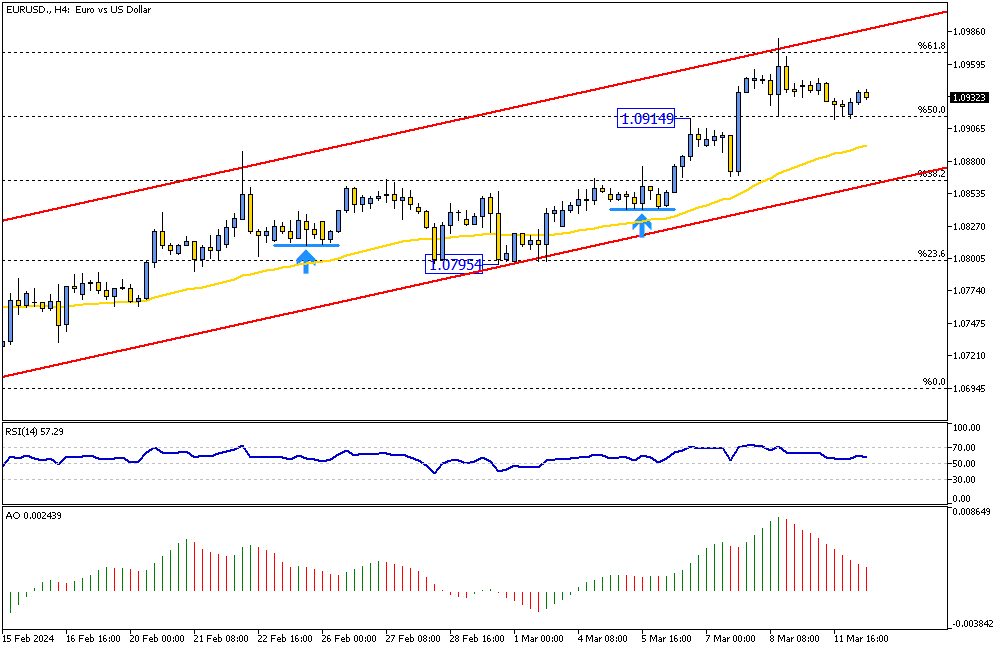
EURUSD's Bullish Momentum: Indicators and Support Levels
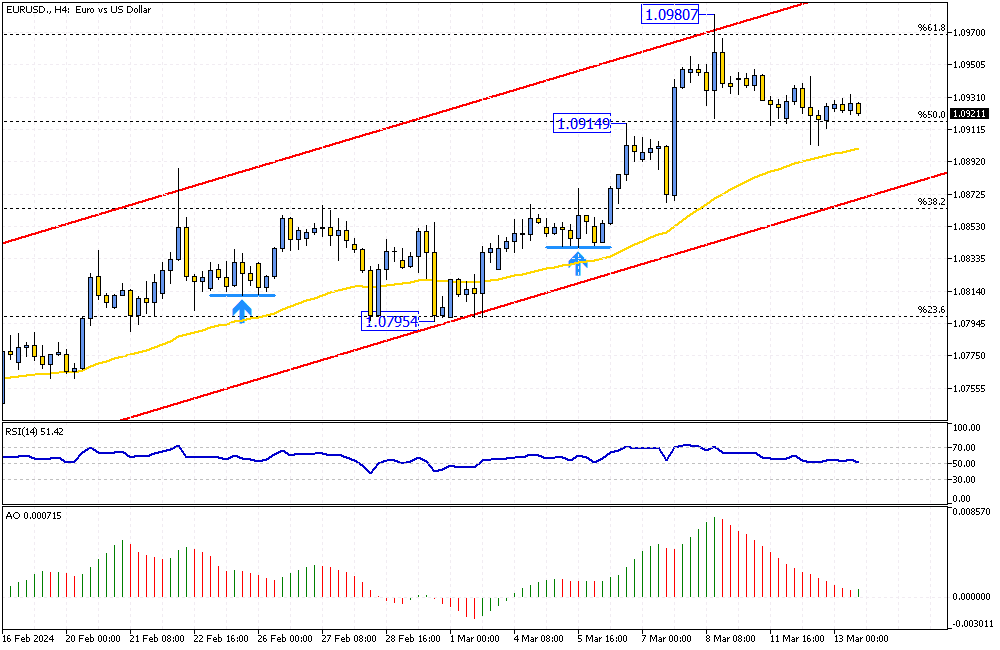
The EURUSD currency pair consolidates its recent gains above the 50% Fibonacci support level, the 1.091 mark, where it formed a hammer candlestick pattern.
As of writing, the Euro trades at about 1.092, with the RSI indicator hovering above 50, which can be interpreted as a signal for the continuation of the uptrend. The EMA 50 and the lower band of the bullish channel support the current uptick momentum. That said, the bull market is likely to extend and test 1.098 as its first barrier.
Conversely, the 38.2% level divides the bull market from the bear market. Therefore, if the price dips below this level, the bull market should be invalidated.Though trading on financial markets involves high risk, it can still generate extra income in case you apply the right approach. By choosing a reliable broker such as InstaForex you get access to the international financial markets and open your way towards financial independence. You can sign up here.
-
The Following 3 Users Say Thank You to Solid ECN For This Useful Post:
Unregistered (3)
-
Senior Member
- Join Date
- Oct 2022
- Posts
- 1,182
- Thanks
- 1
- Thanked 1,564 Times in 522 Posts
Significant Silver Price Dip from Three-Year High
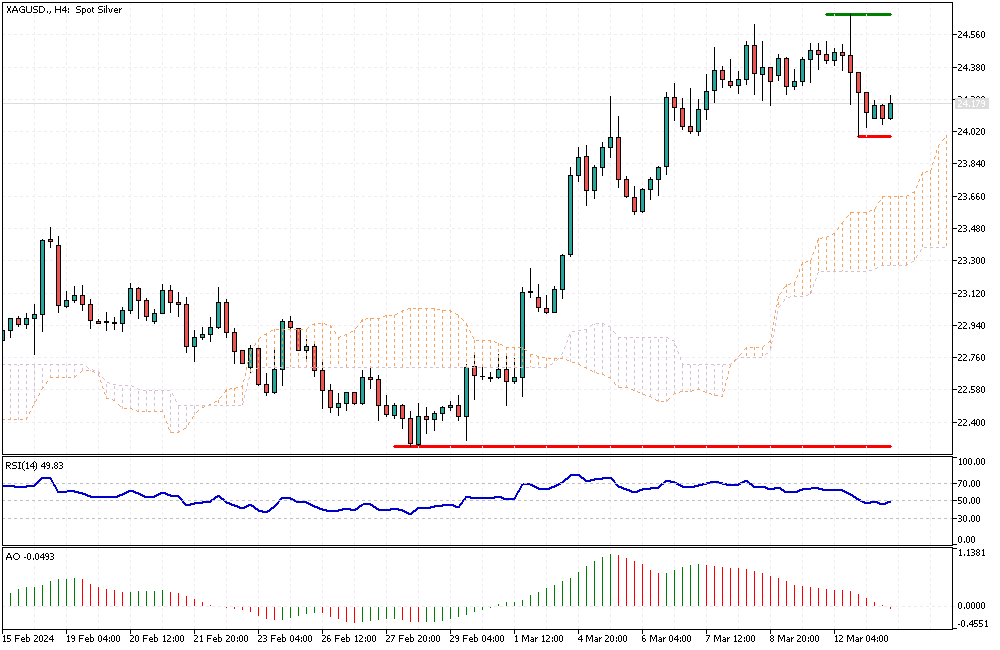
Solid ECN – Silver's price fell to approximately $24 per ounce, a slight decrease from the three-year peak of $24.4 per ounce in the prior session. This change occurred as investors closely monitored the possibility of the Federal Reserve lowering interest rates following the latest U.S. CPI (Consumer Price Index) figures.
These figures, which showed that the annual and core consumer inflation rates were slightly higher than expected, have significantly influenced the market's anticipation of the Federal Reserve cutting interest rates by June. Earlier, officials from the Federal Reserve and the European Central Bank hinted at potential rate decreases in 2024, which further increased the attractiveness of safe-haven assets like silver.Though trading on financial markets involves high risk, it can still generate extra income in case you apply the right approach. By choosing a reliable broker such as InstaForex you get access to the international financial markets and open your way towards financial independence. You can sign up here.
-
The Following 5 Users Say Thank You to Solid ECN For This Useful Post:
Unregistered (5)
-
Senior Member
- Join Date
- Oct 2022
- Posts
- 1,182
- Thanks
- 1
- Thanked 1,564 Times in 522 Posts
Canadian Dollar Dynamics: Economic Insights and Monetary Policy Updates
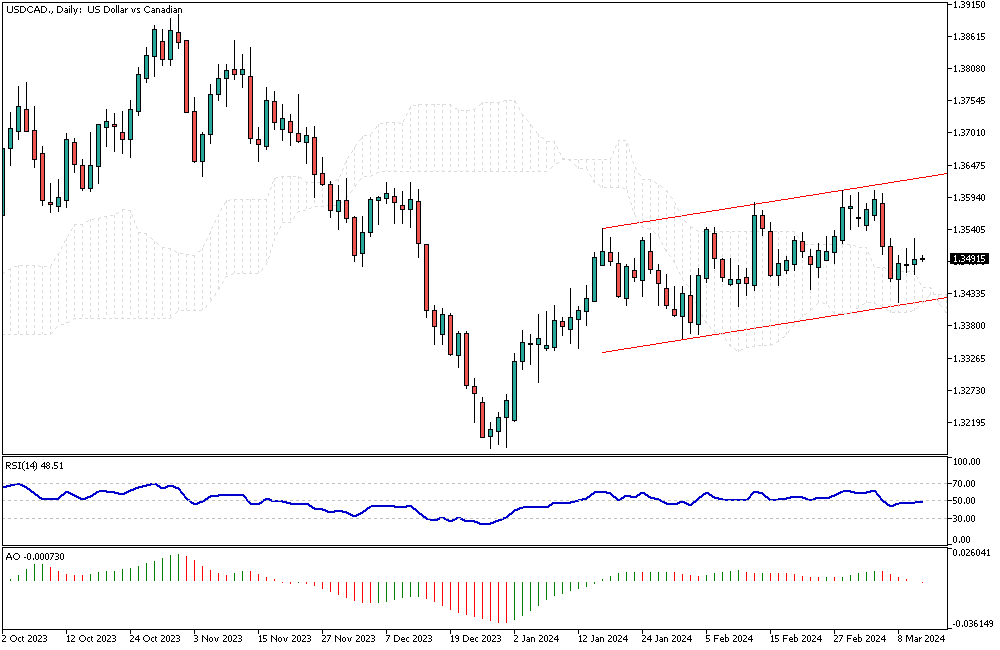
Solid ECN – The Canadian dollar is currently valued at around 1.35 per USD, returning from a one-month peak of 1.345 USD recorded on March 7. This drop is primarily due to the stability and strength of the US dollar. Meanwhile, the Federal Reserve is expected to hold interest rates steady at its upcoming March 19-20 meeting, with predictions leaning towards a rate cut in June. This decision comes after the consumer price index indicated a slight increase beyond expectations. Specifically, the overall inflation rate went up to 3.2%, surpassing forecasts, while the core inflation rate decreased slightly to 3.8% from 3.9%, still over the expected 3.7%.
In February, the unemployment rate in Canada increased to 5.8%, aligning with analysts' predictions. The country also witnessed an addition of 42,000 jobs, exceeding the anticipated numbers and showcasing a solid job market. Consequently, this strength allows the Bank of Canada to keep its monetary policy tight, helping curb further drops in the value of the Canadian dollar, also known as the loonie.Though trading on financial markets involves high risk, it can still generate extra income in case you apply the right approach. By choosing a reliable broker such as InstaForex you get access to the international financial markets and open your way towards financial independence. You can sign up here.
-
The Following 5 Users Say Thank You to Solid ECN For This Useful Post:
Unregistered (5)
-
Senior Member
- Join Date
- Oct 2022
- Posts
- 1,182
- Thanks
- 1
- Thanked 1,564 Times in 522 Posts
NZDUSD's Critical Levels: EMA 50 as the Decisive Barrier
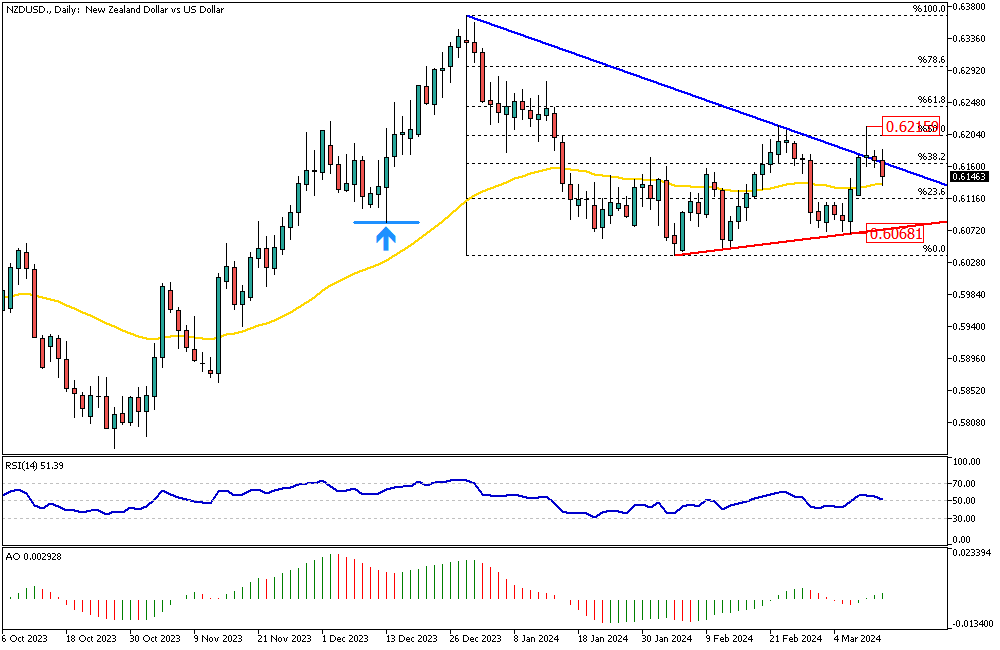
Solid ECN – The NZDUSD currency pair failed to stabilize the price above the 38.2% Fibonacci support level, and consequently, it dipped below the descending trendline depicted in blue. The EMA 50 is currently preventing the price from dipping further. If this price breaches the 50-exponential moving average, the next target will likely be 0.6068, followed by the February low.
The 0.6215 mark is the pivotal point between a bull and bear market. If the New Zealand dollar breaks this resistance against the U.S. Dollar, the previously mentioned forecast should be invalidated, and traders must reevaluate the market accordingly.Though trading on financial markets involves high risk, it can still generate extra income in case you apply the right approach. By choosing a reliable broker such as InstaForex you get access to the international financial markets and open your way towards financial independence. You can sign up here.
-
The Following 5 Users Say Thank You to Solid ECN For This Useful Post:
Unregistered (5)
-
Senior Member
- Join Date
- Oct 2022
- Posts
- 1,182
- Thanks
- 1
- Thanked 1,564 Times in 522 Posts
Bearish Signals: AUDUSD Technical Indicators Review
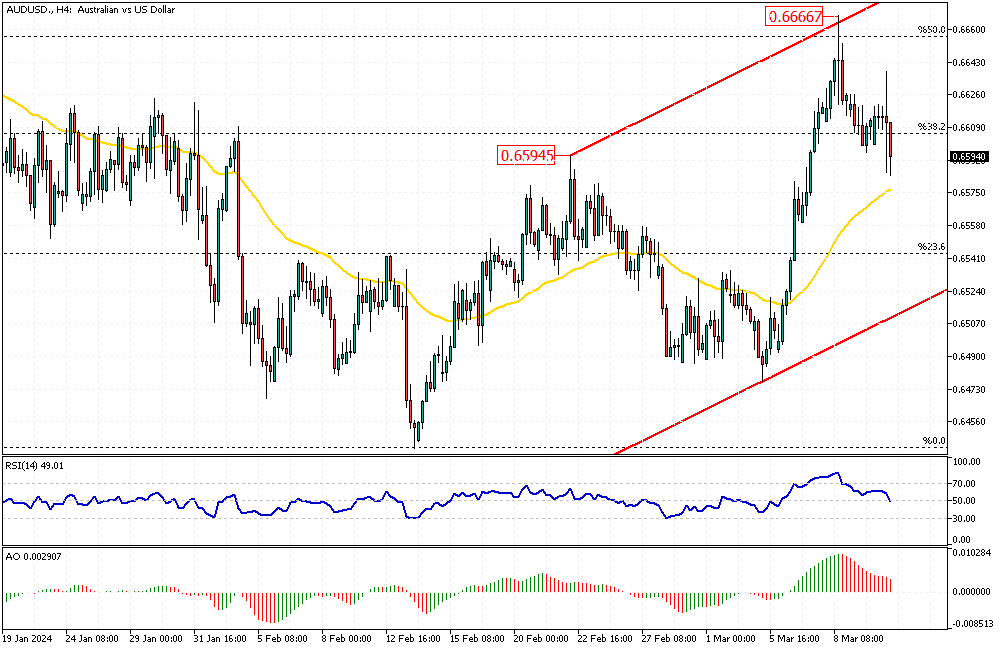
Solid ECN – The seller of the AUDUSD pair formed a long wick candlestick pattern on the 4-hour chart, close to the 50% Fibonacci resistance at the 0.666 mark. Consequently, the pair dipped below 38.2% and is testing the EMA 50 as of writing.
The technical indicators signal a bear market, with the RSI closing below 50 and the Awesome Oscillator bars being red and declining.
From a technical standpoint, the AUDUSD pair has created a new higher high since the beginning of the year, and this is the first time the value went as high as 0.666. Therefore, the Australian currency is bullish against the U.S. dollar. That said, if the EMA 50 can withstand today's selling pressure, the market will likely aim for the upper band of the rising flag, which is close to the 61.8% resistance level.
Conversely, if the AUDUSD dips below the EMA 50, the next support level is 23.6%. Traders should watch the EMA 50 closely and adjust their strategy accordingly.Though trading on financial markets involves high risk, it can still generate extra income in case you apply the right approach. By choosing a reliable broker such as InstaForex you get access to the international financial markets and open your way towards financial independence. You can sign up here.
-
The Following 5 Users Say Thank You to Solid ECN For This Useful Post:
Unregistered (5)
-
Senior Member
- Join Date
- Oct 2022
- Posts
- 1,182
- Thanks
- 1
- Thanked 1,564 Times in 522 Posts
GBPUSD's Potential Downshift and Support Levels

Solid ECN – The pound sterling has pulled back from a significant level, the 78.6% Fibonacci resistance against the U.S. Dollar, resulting in the pair trading below 1.2827. Concurrently, the RSI indicator has retreated from the overbought area and is heading toward the 50 level.
This downshift could extend to the EMA 50, which aligns with the rising trendline.
Traders should pay close attention to the 61.8% Fibonacci support, which could present buying opportunities. If this level holds, the GBPUSD price will likely rise and retest the 1.2893 resistance.
However, if the rising trendline breaks, it's a clear sign that the bullish scenario should be invalidated. In this case, the consolidation phase will likely extend to the 1.2599 mark, the 50% Fibonacci support.
Therefore, we suggest observing the market's behavior around the EMA 50.Though trading on financial markets involves high risk, it can still generate extra income in case you apply the right approach. By choosing a reliable broker such as InstaForex you get access to the international financial markets and open your way towards financial independence. You can sign up here.
-
The Following 4 Users Say Thank You to Solid ECN For This Useful Post:
Unregistered (4)
-
Senior Member
- Join Date
- Oct 2022
- Posts
- 1,182
- Thanks
- 1
- Thanked 1,564 Times in 522 Posts
Protect Your Trades with Solid ECN's Solid-Shield Feature
At Solid ECN, we prioritize the peace of mind of our traders, especially in times of market volatility. We are committed to upholding the highest standards of trading safety and have introduced the Solid-Shield feature to enhance your trading experience.
Solid-Shield is an innovative tool designed to protect traders from the risk of negative balances. This means that even in highly volatile market conditions, where margin calls and stop-outs might typically lead to a negative balance, traders with Solid ECN are wholly safeguarded against this risk.
The feature automatically resets a trader's balance to zero if it turns negative after a stop-out, ensuring that our traders are not liable for any negative balance. This fully automated process provides an extra layer of financial security and allows our traders to focus on their trading strategies without unnecessary stress.
Trade with confidence and security with Solid ECN's Solid-Shield feature.Though trading on financial markets involves high risk, it can still generate extra income in case you apply the right approach. By choosing a reliable broker such as InstaForex you get access to the international financial markets and open your way towards financial independence. You can sign up here.
-
The Following 6 Users Say Thank You to Solid ECN For This Useful Post:
Unregistered (6)
-
Senior Member
- Join Date
- Oct 2022
- Posts
- 1,182
- Thanks
- 1
- Thanked 1,564 Times in 522 Posts
EURUSD's Next Move: Navigating Above 1.091 Key Support
Solid ECN – The EURUSD formed a hammer candlestick pattern on the 4-hour chart, clinging to the 50% Fibonacci support level at the 1.0914 mark. As of writing, the pair is trading at about 1.093, slightly above the resistance. While the European currency gains ground against the U.S. dollar within the bullish channel, the technical indicators do not offer significant insights.
From a technical standpoint, the next target would be 1.1 if the price maintains its position above 50%.
Conversely, if the price dips below the 50% level, it will likely decline to the 38.2% level, coinciding with the lower band of the channel.Though trading on financial markets involves high risk, it can still generate extra income in case you apply the right approach. By choosing a reliable broker such as InstaForex you get access to the international financial markets and open your way towards financial independence. You can sign up here.
-
The Following 4 Users Say Thank You to Solid ECN For This Useful Post:
Unregistered (4)
Results 101 to 110 of 1198

 Reply With Quote