 Thread:


Litecoin Bullish Channel & SMA Testing Insights
Solid ECN—Litecoin trades in the bullish channel, testing the 100-period SMA in today's trading session. Meanwhile, the stochastic oscillator signals an overbought market; however, the candlestick patterns do not give a sell signal.
The technical outlook for the LTCUSD pair will remain bullish. However, for the bull market to resume, the price must close above the 100 SMA. If this scenario unfolds, the next target will be the July 25 low at $66.7.
Moreover, the $58 level plays as the primary support for the bullish scenario. If this level is breached, the bullish outlook will be invalidated.
Malaysia Forex Forum
- Forum
- Forex Charts
- Monitoring
- Forex TV

-
Senior Member


- Join Date
- Oct 2022
- Posts
- 1,334
- Thanks
- 1
- Thanked 2,413 Times in 751 Posts
Though trading on financial markets involves high risk, it can still generate extra income in case you apply the right approach. By choosing a reliable broker such as InstaForex you get access to the international financial markets and open your way towards financial independence. You can sign up here.
-
The Following 17 Users Say Thank You to Solid ECN For This Useful Post:
Unregistered (17)
-
Senior Member
- Join Date
- Oct 2022
- Posts
- 1,334
- Thanks
- 1
- Thanked 2,413 Times in 751 Posts
Ethereum's Butterfly Pattern: Key Support Levels

Solid ECN—Ethereum formed a butterfly pattern in the daily chart. As of writing, the ETH/USD pair is testing the 100-period simple moving average, while the stochastic oscillator is approaching the overbought territory on the 4-hour chart.

From a technical perspective, if the price remains above the ascending trendline and the 50-period SMA, Ethereum's outlook will likely involve testing the July 25 low at $3,083.
On the other hand, a dip below the August 12 low at $2,506 would cancel the bullish outlook. In this scenario, the next supply zone would be $2,303, followed by $2,111.Though trading on financial markets involves high risk, it can still generate extra income in case you apply the right approach. By choosing a reliable broker such as InstaForex you get access to the international financial markets and open your way towards financial independence. You can sign up here.
-
The Following 18 Users Say Thank You to Solid ECN For This Useful Post:
Unregistered (18)
-
Senior Member
- Join Date
- Oct 2022
- Posts
- 1,334
- Thanks
- 1
- Thanked 2,413 Times in 751 Posts
Bitcoin Bat Pattern: Key Price Levels Explained
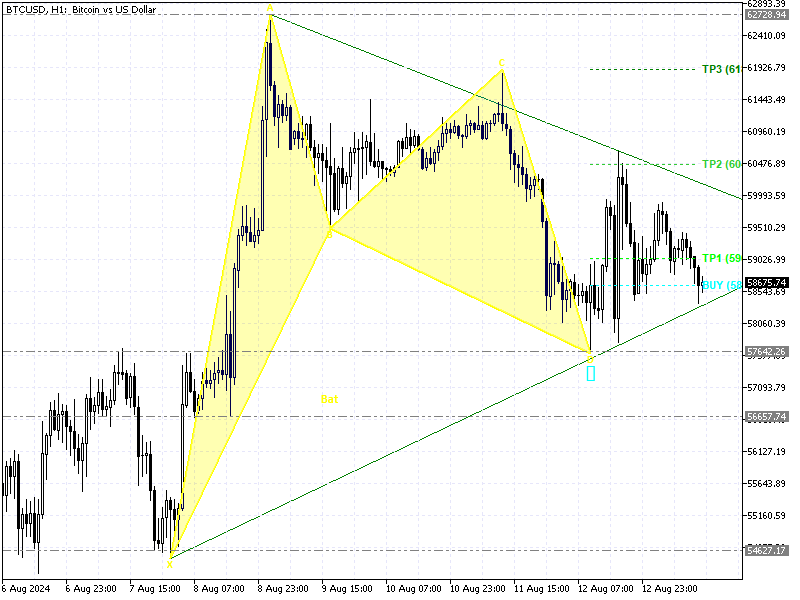
Solid ECN—Bitcoin’s 1-hour chart formed a bat pattern, testing the ascending trendline at approximately $58,700. The bullish outlook should be invalidated if the price dips below the ascending trendline. In this scenario, the decline will likely extend to $56,657.
Conversely, the $61,896 could be targeted if the bulls (buyers) close and stabilize the price above the descending trendline and the $60,467 immediate resistance.Though trading on financial markets involves high risk, it can still generate extra income in case you apply the right approach. By choosing a reliable broker such as InstaForex you get access to the international financial markets and open your way towards financial independence. You can sign up here.
-
The Following 27 Users Say Thank You to Solid ECN For This Useful Post:
Unregistered (27)
-
Senior Member
- Join Date
- Oct 2022
- Posts
- 1,334
- Thanks
- 1
- Thanked 2,413 Times in 751 Posts
Gold is Overpriced in Short-term

Solid ECN—The gold price is overbought, testing the August 2 high at $2,477. The primary trend remains bullish, as the price is above the 50 and 100-period simple moving averages.
However, we expect the price to dip and test the July 17 low at $2,451 before the uptrend resumes. Moreover, if the price breaks below $2,451, the consolidation phase will likely resume near the July 24 high at $2,431.Though trading on financial markets involves high risk, it can still generate extra income in case you apply the right approach. By choosing a reliable broker such as InstaForex you get access to the international financial markets and open your way towards financial independence. You can sign up here.
-
The Following 26 Users Say Thank You to Solid ECN For This Useful Post:
Unregistered (26)
-
Senior Member
- Join Date
- Oct 2022
- Posts
- 1,334
- Thanks
- 1
- Thanked 2,413 Times in 751 Posts
Silver Rebounds Amid Global Metal Recovery

Solid ECN—Silver prices rose above $27 per ounce, recovering from a drop that had pushed the price to a three-month low of $26.8 on August 6th. This increase was supported by a broader recovery in precious metals as market volatility eased, reducing the need to sell bullion to meet margin calls.
The softer stance expected from the Federal Reserve also helped boost silver prices. The central bank is anticipated to cut rates by 100 basis points this year.
Additionally, the PBoC and the BoE implemented looser monetary policies. However, concerns about weak global manufacturing activity limited silver's appeal as an industrial metal. The ISM PMI declined more than expected, highlighting sluggish factory activity in the US, while China's official and Caixin PMI figures also fell short of expectations.Though trading on financial markets involves high risk, it can still generate extra income in case you apply the right approach. By choosing a reliable broker such as InstaForex you get access to the international financial markets and open your way towards financial independence. You can sign up here.
-
The Following 19 Users Say Thank You to Solid ECN For This Useful Post:
Unregistered (19)
-
Senior Member
- Join Date
- Oct 2022
- Posts
- 1,334
- Thanks
- 1
- Thanked 2,413 Times in 751 Posts
Gold Holds Steady as Markets Await Key US Inflation Data

Solid ECN—Gold prices held steady around $2,440 per ounce on Monday as investors awaited key US inflation data later this week, which could provide insight into the Federal Reserve's next moves on interest rates.
Many still expect the Fed to lower rates in September, with some officials suggesting last week that inflation may be slowing enough to justify a rate cut next month. However, after substantial US job numbers, the previous week eased fears of a recession, there is now some disagreement in the market about how significant the rate cut might be.
Gold's appeal as a haven also remained strong, bolstered by ongoing geopolitical tensions, including reports of another Israeli airstrike on Gaza and Moscow's warning of a 'tough response' to Ukraine's actions in Russia.
Investors will closely watch US producer inflation data on Tuesday and consumer inflation figures on Wednesday.Though trading on financial markets involves high risk, it can still generate extra income in case you apply the right approach. By choosing a reliable broker such as InstaForex you get access to the international financial markets and open your way towards financial independence. You can sign up here.
-
The Following 36 Users Say Thank You to Solid ECN For This Useful Post:
Unregistered (36)
-
Senior Member
- Join Date
- Oct 2022
- Posts
- 1,334
- Thanks
- 1
- Thanked 2,413 Times in 751 Posts
WTI Crude Rises Amid Middle East Tensions

Solid ECN—WTI crude oil futures climbed to around $77 per barrel on Monday, marking the fifth consecutive day of gains. The rise is mainly due to ongoing supply concerns amid rising tensions in the Middle East.
Over the weekend, reports surfaced that an Israeli airstrike on a school used as a shelter in Gaza led to the deaths of at least 80 people and injured nearly 50 others. In addition, Hamas expressed doubts about participating in upcoming ceasefire talks scheduled for Thursday.
Oil prices were supported by positive economic data from last week, particularly strong US job numbers, which eased fears of a potential recession. Moreover, expectations for a US interest rate cut grew after some Federal Reserve officials suggested on Friday that inflation might be slowing enough to consider lowering rates as soon as next month, potentially increasing oil demand.Though trading on financial markets involves high risk, it can still generate extra income in case you apply the right approach. By choosing a reliable broker such as InstaForex you get access to the international financial markets and open your way towards financial independence. You can sign up here.
-
The Following 17 Users Say Thank You to Solid ECN For This Useful Post:
Unregistered (17)
-
Banned
- Join Date
- Jul 2024
- Posts
- 695
- Thanks
- 0
- Thanked 8,647 Times in 432 Posts


Pro et contra
Cornu copiae
Though trading on financial markets involves high risk, it can still generate extra income in case you apply the right approach. By choosing a reliable broker such as InstaForex you get access to the international financial markets and open your way towards financial independence. You can sign up here.
-
The Following 23 Users Say Thank You to aadmindebugdebug For This Useful Post:
Unregistered (23)
-
Banned
- Join Date
- Jul 2024
- Posts
- 695
- Thanks
- 0
- Thanked 8,647 Times in 432 Posts
Igni et ferro
A contrario
Though trading on financial markets involves high risk, it can still generate extra income in case you apply the right approach. By choosing a reliable broker such as InstaForex you get access to the international financial markets and open your way towards financial independence. You can sign up here.
-
The Following 41 Users Say Thank You to aadmindebugdebug For This Useful Post:
Unregistered (41)
-
Banned
- Join Date
- Jul 2024
- Posts
- 695
- Thanks
- 0
- Thanked 8,647 Times in 432 Posts
Primus inter pares
De gustibus non disputandum est
Though trading on financial markets involves high risk, it can still generate extra income in case you apply the right approach. By choosing a reliable broker such as InstaForex you get access to the international financial markets and open your way towards financial independence. You can sign up here.
-
The Following 25 Users Say Thank You to aadmindebugdebug For This Useful Post:
Unregistered (25)
Results 1 to 10 of 1354


 Reply With Quote